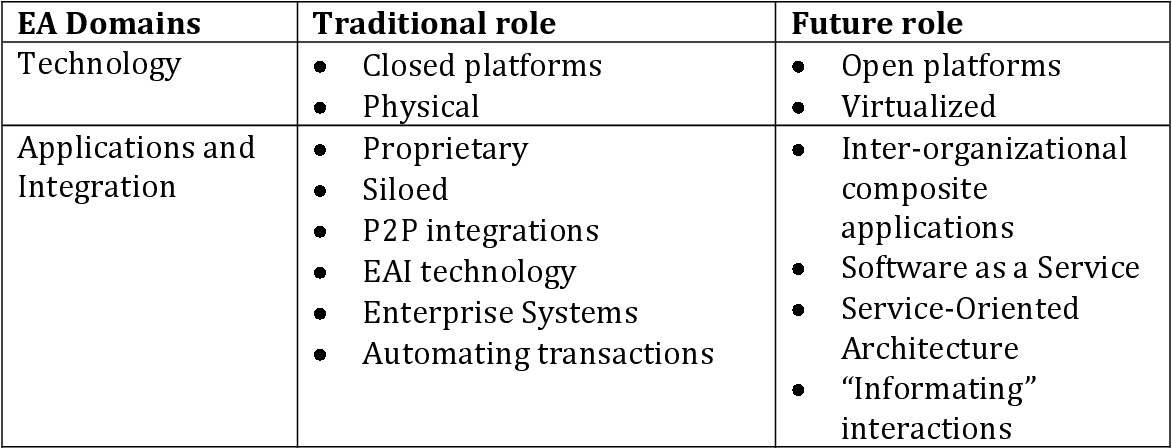
You must preprocess the image to remove the table lines and dots before throwing it into OCR. Here's an approach using OpenCV.
- Load image, grayscale, and Otsu's threshold
- Remove horizontal lines
- Remove vertical lines
- Dilate to connect text and remove dots using contour area filtering
- Bitwise-and to reconstruct image
- OCR
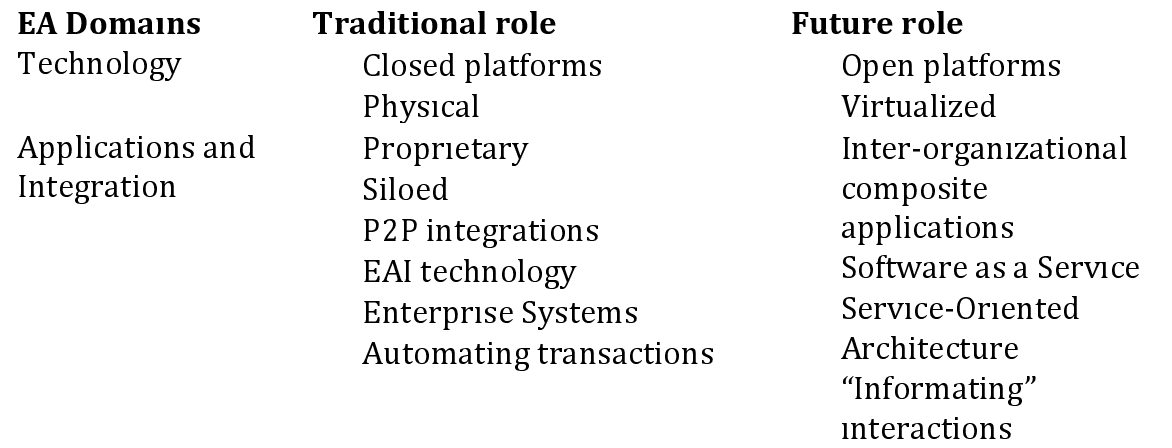
Here's the processed image:
![enter image description here]()
Result from Pytesseract
EA Domains Traditional role Future role
Technology Closed platforms Open platforms
Physical Virtualized
Applications and Proprietary Inter-organizational
Integration Siloed composite
P2P integrations applications
EAI technology Software as a Service
Enterprise Systems Service-Oriented
Automating transactions Architecture
“‘Informating”
interactions
Code
import cv2
import pytesseract

pytesseract.pytesseract.tesseract_cmd = r"C:\Program Files\Tesseract-OCR\tesseract.exe"

# Load image, grayscale, and Otsu's threshold
image = cv2.imread('1.png')
gray = cv2.cvtColor(image, cv2.COLOR_BGR2GRAY)
thresh = cv2.threshold(gray, 0, 255, cv2.THRESH_BINARY_INV + cv2.THRESH_OTSU)[1]

# Remove horizontal lines
horizontal_kernel = cv2.getStructuringElement(cv2.MORPH_RECT, (50,1))
detect_horizontal = cv2.morphologyEx(thresh, cv2.MORPH_OPEN, horizontal_kernel, iterations=2)
cnts = cv2.findContours(detect_horizontal, cv2.RETR_EXTERNAL, cv2.CHAIN_APPROX_SIMPLE)
cnts = cnts[0] if len(cnts) == 2 else cnts[1]
for c in cnts:
    cv2.drawContours(thresh, [c], -1, (0,0,0), 2)

# Remove vertical lines
vertical_kernel = cv2.getStructuringElement(cv2.MORPH_RECT, (1,15))
detect_vertical = cv2.morphologyEx(thresh, cv2.MORPH_OPEN, vertical_kernel, iterations=2)
cnts = cv2.findContours(detect_vertical, cv2.RETR_EXTERNAL, cv2.CHAIN_APPROX_SIMPLE)
cnts = cnts[0] if len(cnts) == 2 else cnts[1]
for c in cnts:
    cv2.drawContours(thresh, [c], -1, (0,0,0), 3)

# Dilate to connect text and remove dots
kernel = cv2.getStructuringElement(cv2.MORPH_RECT, (10,1))
dilate = cv2.dilate(thresh, kernel, iterations=2)
cnts = cv2.findContours(dilate, cv2.RETR_EXTERNAL, cv2.CHAIN_APPROX_SIMPLE)
cnts = cnts[0] if len(cnts) == 2 else cnts[1]
for c in cnts:
    area = cv2.contourArea(c)
    if area < 500:
        cv2.drawContours(dilate, [c], -1, (0,0,0), -1)

# Bitwise-and to reconstruct image
result = cv2.bitwise_and(image, image, mask=dilate)
result[dilate==0] = (255,255,255)

# OCR
data = pytesseract.image_to_string(result, lang='eng',config='--psm 6')
print(data)

cv2.imshow('thresh', thresh)
cv2.imshow('result', result)
cv2.imshow('dilate', dilate)
cv2.waitKey()


