Computing AUC and ROC curve from multi-class data in scikit-learn (sklearn)?
Asked Answered
B

1

7

I am trying to use the scikit-learn module to compute AUC and plot ROC curves for the output of three different classifiers to compare their performance. I am very new to this topic, and I am struggling to understand how the data I have should input to the roc_curve and auc functions.

For each item within the testing set, I have the true value and the output of each of the three classifiers. The classes are ['N', 'L', 'W', 'T']. In addition, I have a confidence score for each value output from the classifiers. How do I pass this information to the roc_curve function?

Do I need to label_binarize my input data? How do I convert a list of [class, confidence] pairs output by the classifiers into the y_score expected by roc_curve?

Thank you for any help! Good resources about ROC curves would also be helpful.

Bartko answered 5/11, 2015 at 15:3 Comment(3)
The ROC curve is intrinsically designed for binary classification. The x and y axes are false and true positive rates, respectively, which are binary classification metrics. You can perhaps extend the ROC curve to a multiclass setting, but I don't think there's a nice standard way to do so, and definitely not something you should do before understanding the ROC in the binary setting.Incantation
@ChesterVonWinchester Okay, then how would I approach this task if I reconceptualize the results as binary? e.g. lumping 'L', 'W', 'T' into a new class 'I'. In the two-class case, how do I take [class, confidence score] pairs and convert them into an appropriate y_score array? edit: assume that a higher confidence score always indicates the 'I' class; a 0 confidence result will always be an 'N' (None).Bartko
why shove a round peg into a square hole?Incantation
W
11

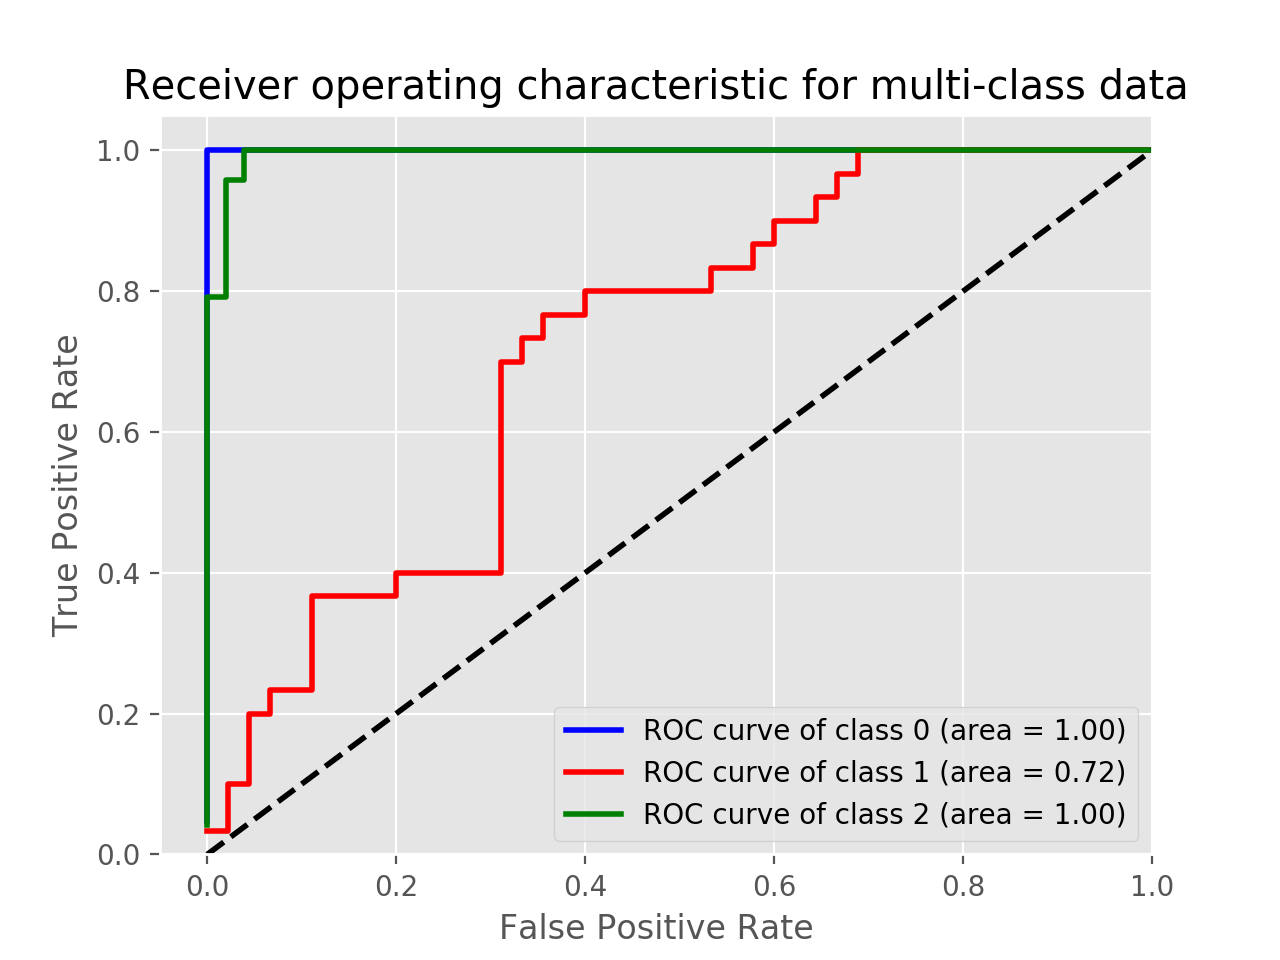
You need to use label_binarize function and then you can plot a multi-class ROC.

Example using Iris data:

import matplotlib.pyplot as plt
from sklearn import svm, datasets
from sklearn.model_selection import train_test_split
from sklearn.preprocessing import label_binarize
from sklearn.metrics import roc_curve, auc
from sklearn.multiclass import OneVsRestClassifier
from itertools import cycle
plt.style.use('ggplot')

iris = datasets.load_iris()
X = iris.data
y = iris.target

# Binarize the output
y = label_binarize(y, classes=[0, 1, 2])
n_classes = y.shape[1]

X_train, X_test, y_train, y_test = train_test_split(X, y, test_size=.5, random_state=0)

classifier = OneVsRestClassifier(svm.SVC(kernel='linear', probability=True,
                                 random_state=0))
y_score = classifier.fit(X_train, y_train).decision_function(X_test)

fpr = dict()
tpr = dict()
roc_auc = dict()
for i in range(n_classes):
    fpr[i], tpr[i], _ = roc_curve(y_test[:, i], y_score[:, i])
    roc_auc[i] = auc(fpr[i], tpr[i])
colors = cycle(['blue', 'red', 'green'])
for i, color in zip(range(n_classes), colors):
    plt.plot(fpr[i], tpr[i], color=color, lw=1.5,
             label='ROC curve of class {0} (area = {1:0.2f})'
             ''.format(i, roc_auc[i]))
plt.plot([0, 1], [0, 1], 'k--', lw=1.5)
plt.xlim([-0.05, 1.0])
plt.ylim([0.0, 1.05])
plt.xlabel('False Positive Rate')
plt.ylabel('True Positive Rate')
plt.title('Receiver operating characteristic for multi-class data')
plt.legend(loc="lower right")
plt.show()

enter image description here

Welker answered 19/7, 2018 at 13:49 Comment(0)

© 2022 - 2024 — McMap. All rights reserved.