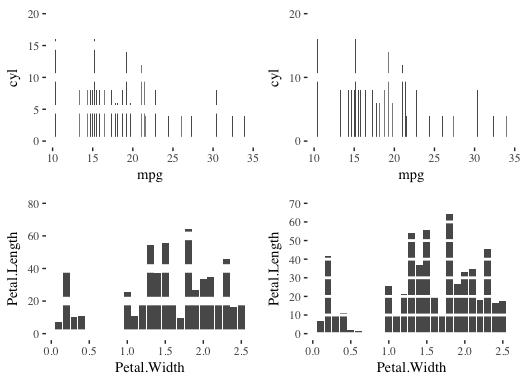
I used Tufte lines with ggplot2 for years now, but I've always wondered if there was an automated way to draw them, so they correspond to axis tics.
The usual way I draw them is like this :
ggplot(mtcars, aes(x=mpg, y=cyl))+
geom_bar(stat = "identity")+
theme_tufte()+
geom_hline(yintercept = c(5,10,15), col="white", lwd=3)

Here I specify the ticks with yintercept = c(5,10,15), but recently I was building a Shiny app with changing axes, so I can't specify fixed ticks.
Is there a way for me to say something like yintercept = tickmarks, so that my Shiny app will always work without precalculating and defining both the axis and the Tufte lines manually?

