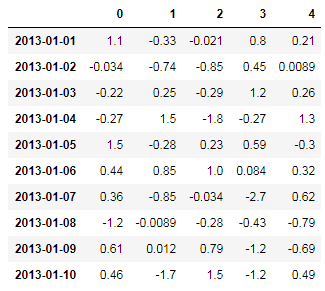
I'm using the style property of Pandas DataFrames to create HTML tables for emailing.
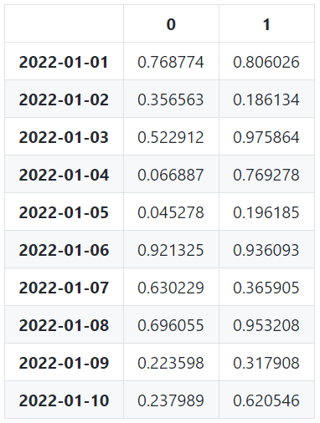
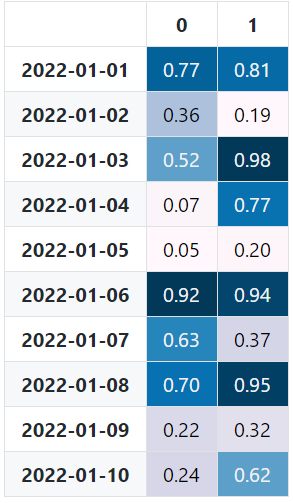
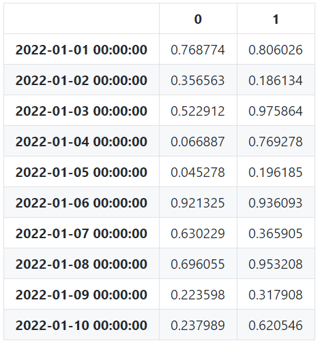
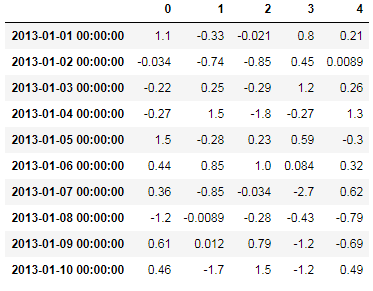
The issue I am having is that I have a datetime index that shows up as a datetime stamp when I'd like it to show as a date instead. I'm not interested in the time part. In the interpreter, the DataFrame does print out correctly (only shows the date part). But when I render after stylizing using the style property of the table, it generates HTML that puts out the time part as well. I've looked into using style.format() but I can't access the index column.
I would reset the index in order to make the datetime column a normal column... but my header columns are MultIndex. If I flatten out and don't use indexes the table looks weird.
Unfortunately I found this in the .style documentation:
Limitations
- DataFrame only (use
Series.to_frame().style)- The index and columns must be unique
- No large repr, and performance isn’t great; this is intended for summary DataFrames
- You can only style the values, not the index or columns
- You can only apply styles, you can’t insert new HTML entities Some of these will be addressed in the future.
https://pandas.pydata.org/pandas-docs/stable/style.html#Limitations
I'm posting to see if anyone has any ideas for how I can get around this. Thanks!
Example table that shows the issue: example_table_link
Code for generating table:
account_day_df = merged[['Day', 'Metric1', 'Metric2', 'Metric3', 'Metric4', 'Campaign type']]
account_day_df = account_day_df.groupby(['Day', 'Campaign type']).sum()
account_day_df.loc[:, 'Metric5'] = account_day_df['Metric1'] / account_day_df['Metric4']
account_day_df = account_day_df.unstack('Campaign type')

html += (
    account_day_df.style
        .background_gradient(cmap=cm, subset=['Metric5'])
        .set_table_attributes('border="1" class="dataframe table table-hover table-bordered"')
        .render(i)
)

