ggplot insert line between factor levels
Asked Answered
A

2

7

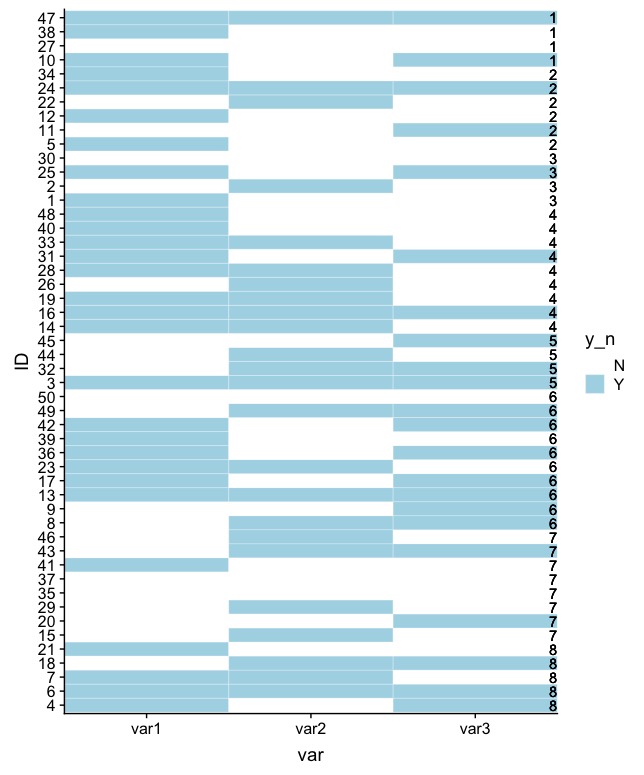
I am making a tilemap in ggplot as below. 2 questions:

1) How can I expand the x-axis limits to label my groups at x = 4? 2) How can I put horizontal lines between Groups (i.e. a line between 1 and 2, 2 and 3, etc.) automatically, not specifying y-value manually?

require(tidyverse)
set.seed(1)
df <- data.frame(ID = as.character(c(1:50)),
                 Group = sample(1:8, 50, replace = T),
                 var1 = sample(c('Y', 'N'), 50, replace = T),
                 var2 = sample(c('Y', 'N'), 50, replace = T),
                 var3 = sample(c('Y', 'N'), 50, replace = T)) %>% 
  gather('var', 'y_n', var1:var3) %>% 
  arrange(-Group) %>% 
  mutate(ID = factor(ID, levels = unique(ID, ordered = T)))

ggplot(df, aes(var, ID, label = Group))+
  geom_tile(aes(fill = y_n), color = 'white')+
  scale_fill_manual(values = c('white', 'lightblue'))+
  scale_x_discrete(expand = c(0, 0))+
  geom_text(x = 3.5, hjust = 'right')

enter image description here

Aftertime answered 25/7, 2018 at 15:25 Comment(0)
B
6

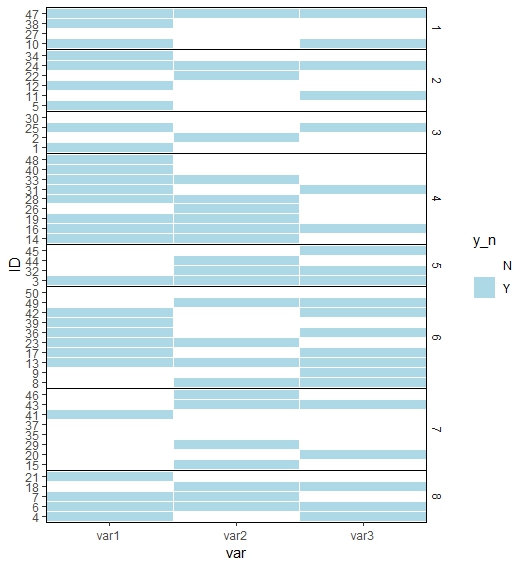
Using facets solves both your problems: if you facet by Group you can edit the facet panel to specify a black border around each group, and it will automatically label each group outside the plot area.

ggplot(df, aes(var, ID, label = Group)) +
  geom_tile(aes(fill = y_n), color = 'white') +
  scale_fill_manual(values = c('white', 'lightblue')) +
  scale_x_discrete(expand = c(0, 0)) +
  facet_grid(Group~., scales = "free", space = "free") + #facet by group
  theme(strip.background = element_blank(), #remove background for facet labels
        panel.border = element_rect(colour = "black", fill = NA), #add black border
        panel.spacing = unit(0, "lines")) #remove space between facets

Within facet_grid(), It's important to add scales = "free" so each facet has only the y values present for that group, and add space = free so the size of each group is adjusted based on how many y-values it has.

enter image description here

Blackfoot answered 25/7, 2018 at 16:43 Comment(4)
@user42485, two suggestions to make the plot more similar to what you want using this answer: 1) add strip.text.y = element_text(angle = 0) to theme. 2) Check this post to see how to draw only horizontal lines between facets: #28652784. Also: there's no need for aes(..., label = Group) here.Ontina
@Jan-Boyer This is great. I didn't know about the space for faceting and panel.spacing options. I have copied and pasted your code exactly, and my output is not giving the panel.borders. I have tried increasing the size to make the lines even more obvious, but they're not there. I've run dev.off() and restarted R. Can you think of anything that might be preventing the panel.border line from working?Aftertime
@Aftertime what version of ggplot are you using? I'm running the most recent one (3.0.0) installed; and I remember seeing that some terminology for the facet theme options had changed between versions.Blackfoot
@Aftertime or an easy workaround if the panel.border() isn't working for you would be to use one of the built in themes that includes panel borders by default (theme_bw() and theme_linedraw() have black borders)Blackfoot
J
5

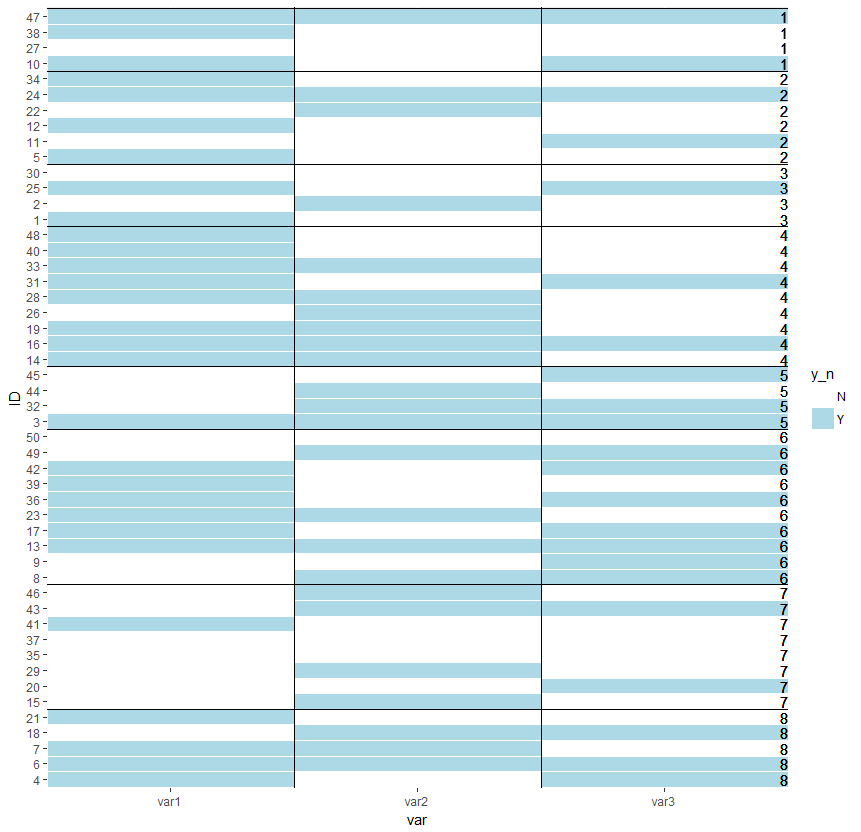
You can try a geom_hline approach. Added also vertical lines for demonstrantion purposes.

# calculate the group numbers
gr <- df %>% 
  group_by(Group) %>%
  summarise(n=length(unique(ID))) %>%
  arrange(-Group) %>% 
  mutate(nn=cumsum(n))


ggplot(df, aes(var, ID, label = Group))+
  geom_tile(aes(fill = y_n), color = 'white')+
  scale_fill_manual(values = c('white', 'lightblue'))+
  scale_x_discrete(expand = c(0, 0))+
  geom_text(x = 3.5, hjust = 'right') + 
  geom_vline(xintercept = 1:length(unique(df$var))+0.5)+
  geom_hline(yintercept = gr$nn+0.5)

enter image description here

Joycejoycelin answered 25/7, 2018 at 15:29 Comment(2)
This is not what the OP wants. They want hlines between each group as specified on the right y-axisCollar
@Tjebo you are absolutly right. Please see my edits.Joycejoycelin

© 2022 - 2024 — McMap. All rights reserved.