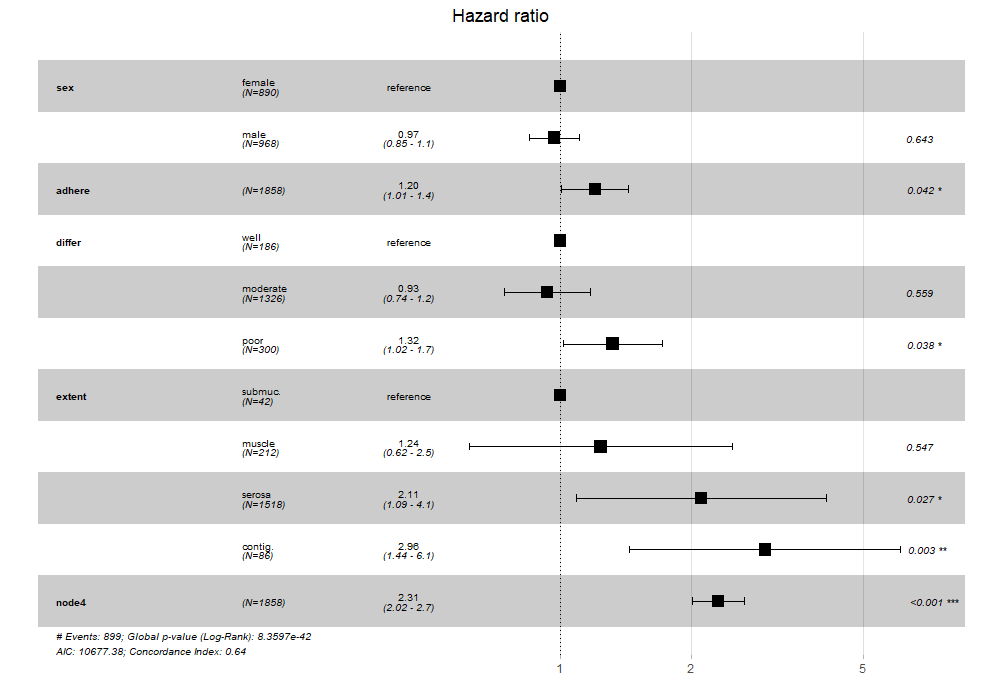
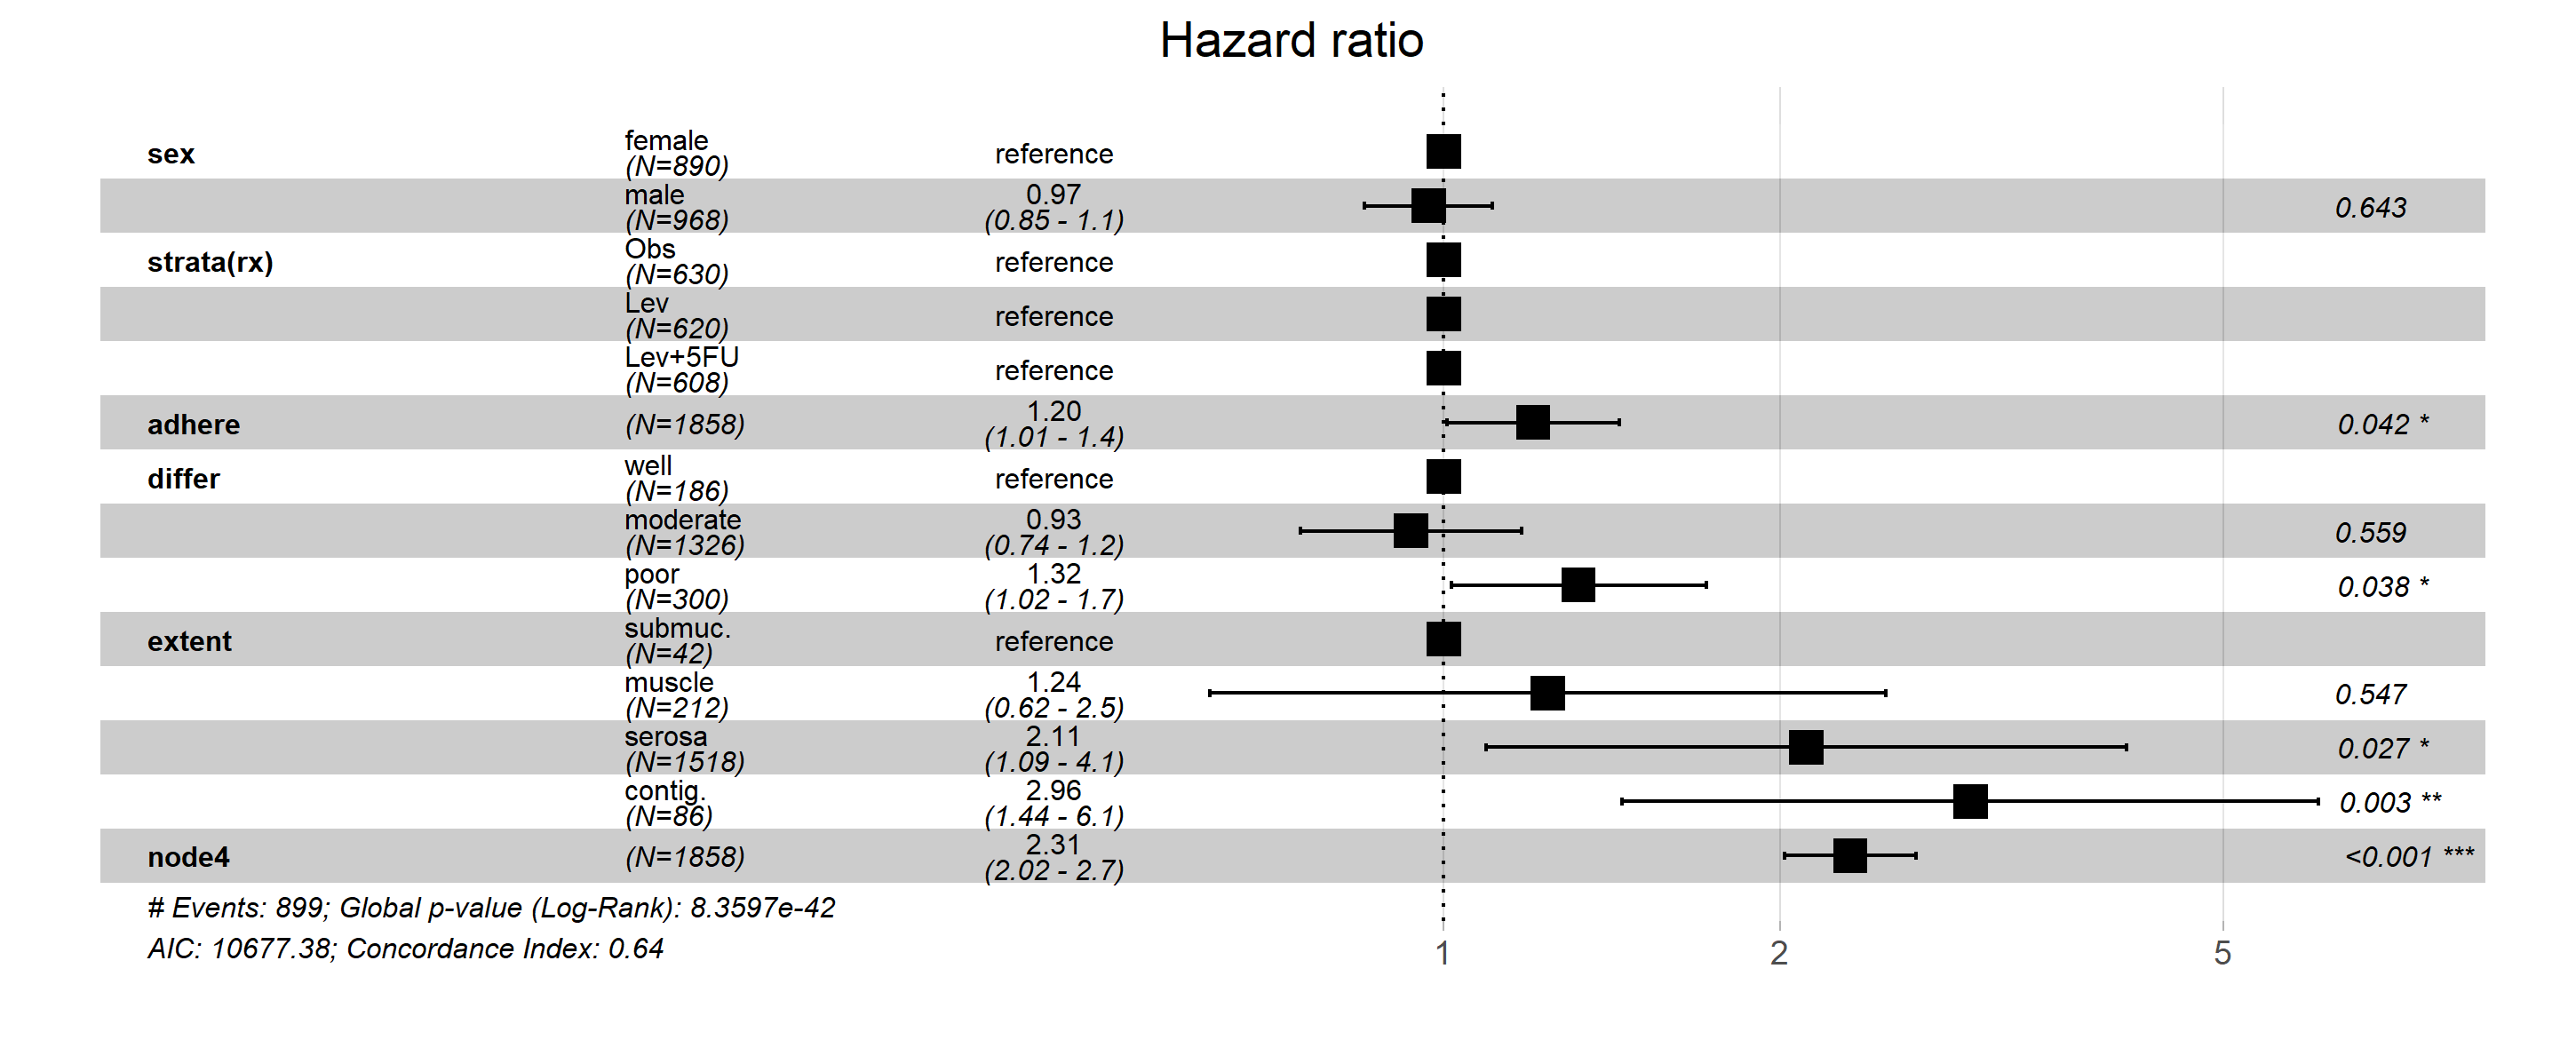
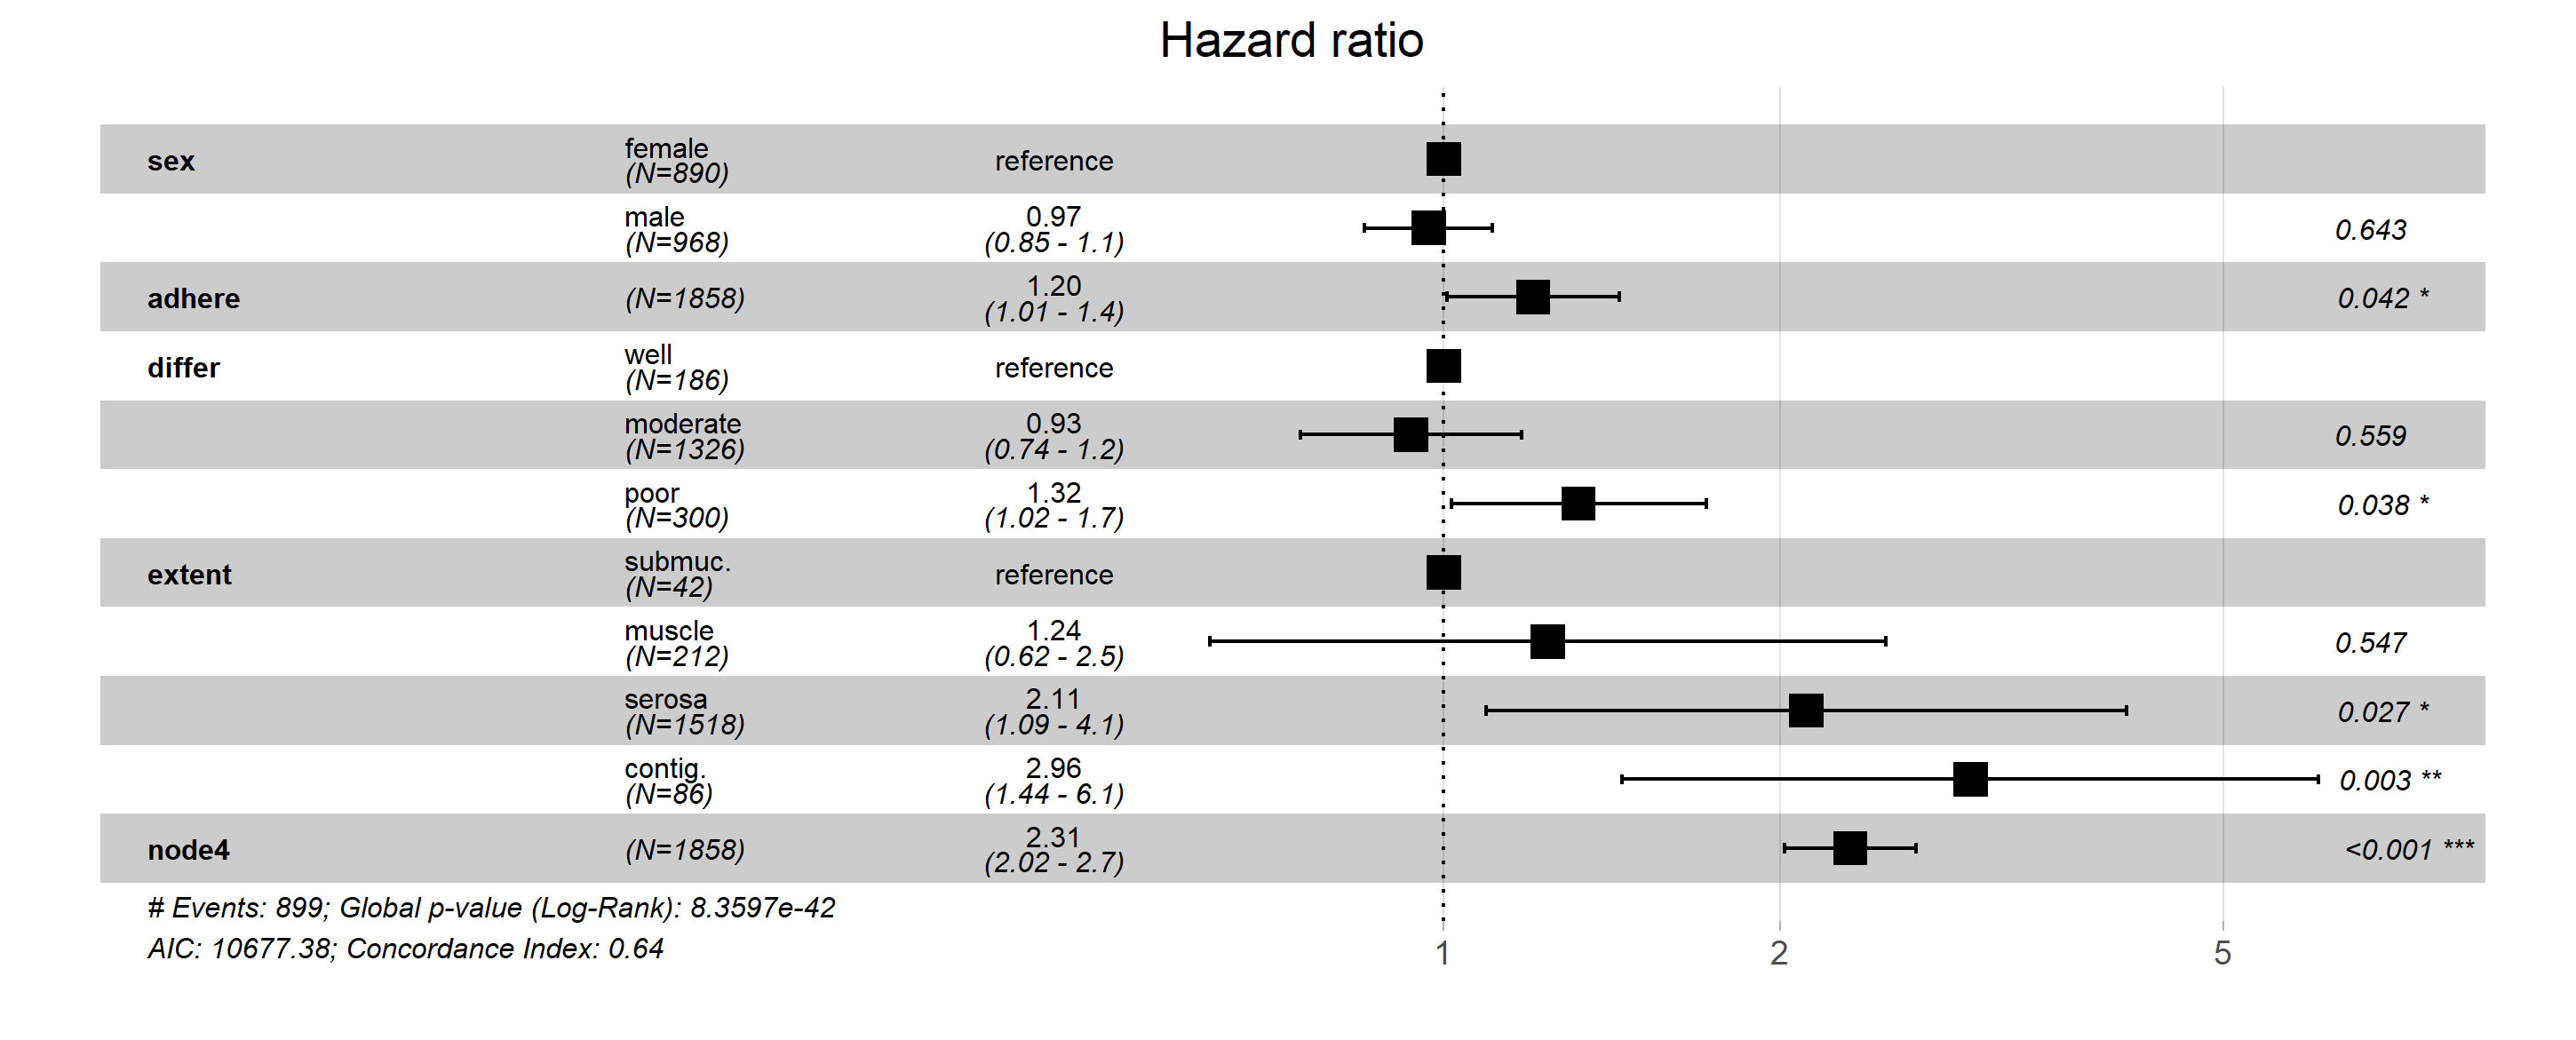
I gather that the desired forest plot is one that simply skips the stratified RX variable in the model's formula. If so, we can simply insert an if clause inside, to ignore formula parts that don't correspond exactly to column names in the data (e.g. "strata(rx)" is not a column name).
Approach 1
If you are comfortable with R sufficiently to modify functions, run trace(ggforest, edit = TRUE) and replace the allTerms <- lapply(...) (around lines 10-25) in the pop-up window with the following version:
allTerms <- lapply(seq_along(terms), function(i) {
  var <- names(terms)[i]
  if(var %in% colnames(data)) {
    if (terms[i] %in% c("factor", "character")) {
      adf <- as.data.frame(table(data[, var]))
      cbind(var = var, adf, pos = 1:nrow(adf))
    }
    else if (terms[i] == "numeric") {
      data.frame(var = var, Var1 = "", Freq = nrow(data),
                 pos = 1)
    }
    else {
      vars = grep(paste0("^", var, "*."), coef$term,
                  value = TRUE)
      data.frame(var = vars, Var1 = "", Freq = nrow(data),
                 pos = seq_along(vars))
    }
  } else {
    message(var, "is not found in data columns, and will be skipped.")
  }

})
ggforest(stratamodel) # this should work after the modification
![plot]()
The modification will not persist to subsequent R sessions. If you want to reverse the modification within the current session, simply run untrace(ggforest).
Approach 2
If you prefer to have a permanently modified version of the function for future use / don't want to muck around with a library's function, save the function below:
ggforest2 <- function (model, data = NULL, main = "Hazard ratio",
                       cpositions = c(0.02, 0.22, 0.4), fontsize = 0.7,
                       refLabel = "reference", noDigits = 2) {
  conf.high <- conf.low <- estimate <- NULL
  stopifnot(class(model) == "coxph")
  data <- survminer:::.get_data(model, data = data)
  terms <- attr(model$terms, "dataClasses")[-1]
  coef <- as.data.frame(broom::tidy(model))
  gmodel <- broom::glance(model)
  allTerms <- lapply(seq_along(terms), function(i) {
    var <- names(terms)[i]
    if(var %in% colnames(data)) {
      if (terms[i] %in% c("factor", "character")) {
        adf <- as.data.frame(table(data[, var]))
        cbind(var = var, adf, pos = 1:nrow(adf))
      }
      else if (terms[i] == "numeric") {
        data.frame(var = var, Var1 = "", Freq = nrow(data),
                   pos = 1)
      }
      else {
        vars = grep(paste0("^", var, "*."), coef$term,
                    value = TRUE)
        data.frame(var = vars, Var1 = "", Freq = nrow(data),
                   pos = seq_along(vars))
      }
    } else {
      message(var, "is not found in data columns, and will be skipped.")
    }
  })
  allTermsDF <- do.call(rbind, allTerms)
  colnames(allTermsDF) <- c("var", "level", "N",
                            "pos")
  inds <- apply(allTermsDF[, 1:2], 1, paste0, collapse = "")
  rownames(coef) <- gsub(coef$term, pattern = "`", replacement = "")
  toShow <- cbind(allTermsDF, coef[inds, ])[, c("var", "level", "N", "p.value",
                                                "estimate", "conf.low",
                                                "conf.high", "pos")]
  toShowExp <- toShow[, 5:7]
  toShowExp[is.na(toShowExp)] <- 0
  toShowExp <- format(exp(toShowExp), digits = noDigits)
  toShowExpClean <- data.frame(toShow, pvalue = signif(toShow[, 4], noDigits + 1),
                               toShowExp)
  toShowExpClean$stars <- paste0(round(toShowExpClean$p.value, noDigits + 1), " ",
                                 ifelse(toShowExpClean$p.value < 0.05, "*", ""),
                                 ifelse(toShowExpClean$p.value < 0.01, "*", ""),
                                 ifelse(toShowExpClean$p.value < 0.001, "*", ""))
  toShowExpClean$ci <- paste0("(", toShowExpClean[, "conf.low.1"],
                              " - ", toShowExpClean[, "conf.high.1"], ")")
  toShowExpClean$estimate.1[is.na(toShowExpClean$estimate)] = refLabel
  toShowExpClean$stars[which(toShowExpClean$p.value < 0.001)] = "<0.001 ***"
  toShowExpClean$stars[is.na(toShowExpClean$estimate)] = ""
  toShowExpClean$ci[is.na(toShowExpClean$estimate)] = ""
  toShowExpClean$estimate[is.na(toShowExpClean$estimate)] = 0
  toShowExpClean$var = as.character(toShowExpClean$var)
  toShowExpClean$var[duplicated(toShowExpClean$var)] = ""
  toShowExpClean$N <- paste0("(N=", toShowExpClean$N, ")")
  toShowExpClean <- toShowExpClean[nrow(toShowExpClean):1, ]
  rangeb <- range(toShowExpClean$conf.low, toShowExpClean$conf.high,
                  na.rm = TRUE)
  breaks <- axisTicks(rangeb/2, log = TRUE, nint = 7)
  rangeplot <- rangeb
  rangeplot[1] <- rangeplot[1] - diff(rangeb)
  rangeplot[2] <- rangeplot[2] + 0.15 * diff(rangeb)
  width <- diff(rangeplot)
  y_variable <- rangeplot[1] + cpositions[1] * width
  y_nlevel <- rangeplot[1] + cpositions[2] * width
  y_cistring <- rangeplot[1] + cpositions[3] * width
  y_stars <- rangeb[2]
  x_annotate <- seq_len(nrow(toShowExpClean))
  annot_size_mm <- fontsize *
    as.numeric(grid::convertX(unit(theme_get()$text$size, "pt"), "mm"))
  p <- ggplot(toShowExpClean,
              aes(seq_along(var), exp(estimate))) +
    geom_rect(aes(xmin = seq_along(var) - 0.5,
                  xmax = seq_along(var) + 0.5,
                  ymin = exp(rangeplot[1]),
                  ymax = exp(rangeplot[2]),
                  fill = ordered(seq_along(var)%%2 + 1))) +
    scale_fill_manual(values = c("#FFFFFF33",  "#00000033"), guide = "none") +
    geom_point(pch = 15, size = 4) +
    geom_errorbar(aes(ymin = exp(conf.low), ymax = exp(conf.high)),
                  width = 0.15) +
    geom_hline(yintercept = 1, linetype = 3) +
    coord_flip(ylim = exp(rangeplot)) +
    ggtitle(main) +
    scale_y_log10(name = "", labels = sprintf("%g", breaks),
                  expand = c(0.02, 0.02), breaks = breaks) +
    theme_light() +
    theme(panel.grid.minor.y = element_blank(),
          panel.grid.minor.x = element_blank(),
          panel.grid.major.y = element_blank(),
          legend.position = "none",
          panel.border = element_blank(),
          axis.title.y = element_blank(),
          axis.text.y = element_blank(),
          axis.ticks.y = element_blank(),
          plot.title = element_text(hjust = 0.5)) +
    xlab("") +
    annotate(geom = "text", x = x_annotate, y = exp(y_variable),
             label = toShowExpClean$var, fontface = "bold",
             hjust = 0, size = annot_size_mm) +
    annotate(geom = "text", x = x_annotate, y = exp(y_nlevel), hjust = 0,
             label = toShowExpClean$level,
             vjust = -0.1, size = annot_size_mm) +
    annotate(geom = "text", x = x_annotate, y = exp(y_nlevel),
             label = toShowExpClean$N, fontface = "italic", hjust = 0,
             vjust = ifelse(toShowExpClean$level == "", 0.5, 1.1),
             size = annot_size_mm) +
    annotate(geom = "text", x = x_annotate, y = exp(y_cistring),
             label = toShowExpClean$estimate.1, size = annot_size_mm,
             vjust = ifelse(toShowExpClean$estimate.1 == "reference", 0.5, -0.1)) +
    annotate(geom = "text", x = x_annotate, y = exp(y_cistring),
             label = toShowExpClean$ci, size = annot_size_mm,
             vjust = 1.1, fontface = "italic") +
    annotate(geom = "text", x = x_annotate, y = exp(y_stars),
             label = toShowExpClean$stars, size = annot_size_mm,
             hjust = -0.2, fontface = "italic") +
    annotate(geom = "text", x = 0.5, y = exp(y_variable),
             label = paste0("# Events: ", gmodel$nevent,
                            "; Global p-value (Log-Rank): ",
                            format.pval(gmodel$p.value.log, eps = ".001"),
                            " \nAIC: ", round(gmodel$AIC, 2),
                            "; Concordance Index: ", round(gmodel$concordance, 2)),
             size = annot_size_mm, hjust = 0, vjust = 1.2, fontface = "italic")
  gt <- ggplot_gtable(ggplot_build(p))
  gt$layout$clip[gt$layout$name == "panel"] <- "off"
  ggpubr::as_ggplot(gt)
}
It's a snapshot of the ggforest function as it currently stands, with the same modification as above. If the package's creator makes modifications to the package in the future, this can break or become outdated. But for now, ggforest2(stratamodel) will yield the same result as Approach 1.


ggforestis a wrapper, so coding with the underlying ggplot should certainly work. The issue here is that the pool of SO users who are familiar with both stratified models and ggplot2 may not be very large. If you can include a rough sketch of what the stratified model's plot should look like, your chances of getting help would probably increase. – Jae