Plotly: Remove legend title using template
Asked Answered
S

4

7

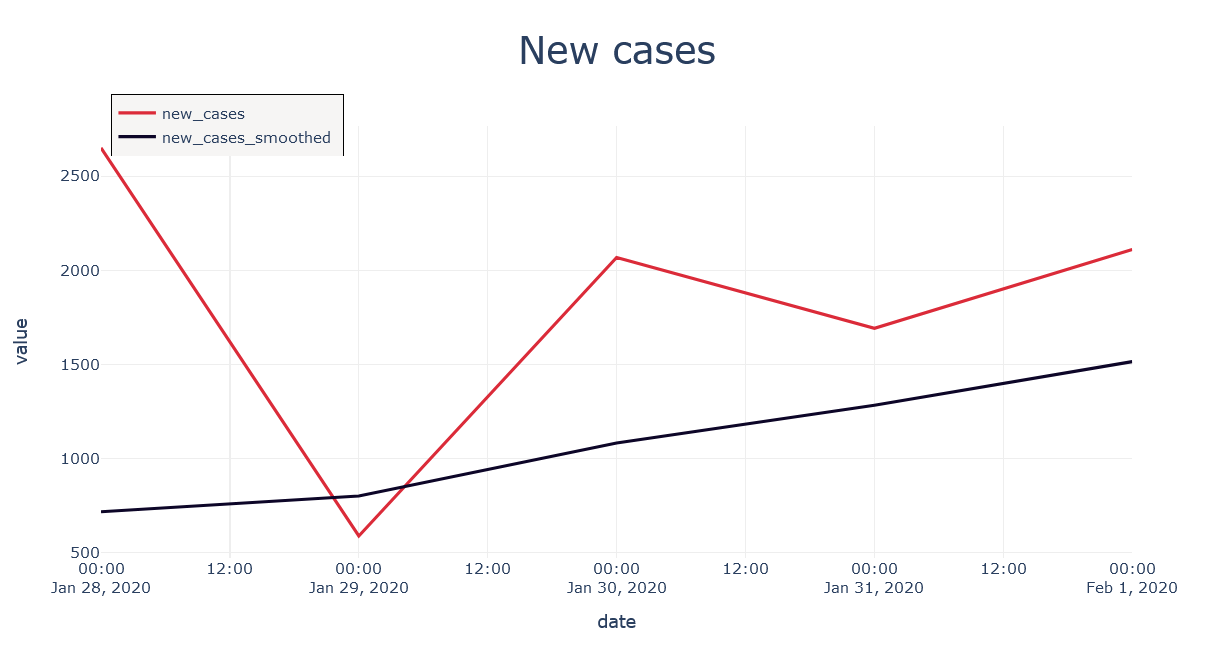
Even after passing 'title':None inside layout.legend in the template, the chart still shows a legend title, whereas it should change the default setting to no legend title.passed in template
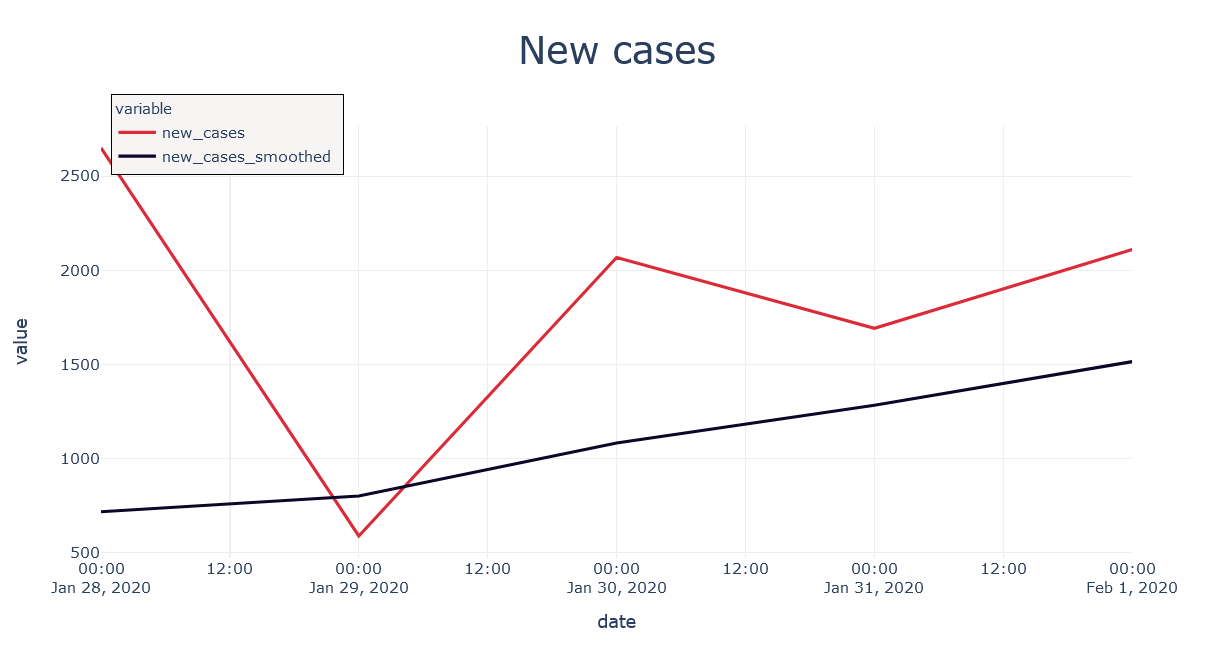
If I manually pass it though with fig.update_layout(), it then removes the title.

passed separately

Why is this happening and how do I change the default setting to no legend title?

Here's the code to recreate the graph (The manual passing in update.layout() is commented out)-

import plotly.graph_objects as go
import plotly.io as pio
import plotly.express as px
import pandas as pd

pio.templates['my_theme'] = go.layout.Template({
    'layout': {'annotationdefaults': {'arrowcolor': '#2a3f5f', 'arrowhead': 0, 'arrowwidth': 1},
               'autotypenumbers': 'strict',
               'coloraxis': {'colorbar': {'outlinewidth': 0, 'ticks': ''}},
               'colorscale': {'diverging': [[0, '#8e0152'], [0.1, '#c51b7d'],
                                            [0.2, '#de77ae'], [0.3, '#f1b6da'],
                                            [0.4, '#fde0ef'], [0.5, '#f7f7f7'],
                                            [0.6, '#e6f5d0'], [0.7, '#b8e186'],
                                            [0.8, '#7fbc41'], [0.9, '#4d9221'], [1,
                                            '#276419']],
                              'sequential': [[0.0, '#0d0887'],
                                             [0.1111111111111111, '#46039f'],
                                             [0.2222222222222222, '#7201a8'],
                                             [0.3333333333333333, '#9c179e'],
                                             [0.4444444444444444, '#bd3786'],
                                             [0.5555555555555556, '#d8576b'],
                                             [0.6666666666666666, '#ed7953'],
                                             [0.7777777777777778, '#fb9f3a'],
                                             [0.8888888888888888, '#fdca26'], [1.0,
                                             '#f0f921']],
                              'sequentialminus': [[0.0, '#0d0887'],
                                                  [0.1111111111111111, '#46039f'],
                                                  [0.2222222222222222, '#7201a8'],
                                                  [0.3333333333333333, '#9c179e'],
                                                  [0.4444444444444444, '#bd3786'],
                                                  [0.5555555555555556, '#d8576b'],
                                                  [0.6666666666666666, '#ed7953'],
                                                  [0.7777777777777778, '#fb9f3a'],
                                                  [0.8888888888888888, '#fdca26'],
                                                  [1.0, '#f0f921']]},
               'colorway': ["#db2b39","#3d405b","#2fbf71","#faa613","#00a6fb"],
               'font': {'color': '#2a3f5f'},
               'geo': {'bgcolor': 'white',
                       'lakecolor': 'white',
                       'landcolor': '#E5ECF6',
                       'showlakes': True,
                       'showland': True,
                       'subunitcolor': 'white'},
               'hoverlabel': {'align': 'left'},
               'hovermode': 'closest',
               'legend': {'orientation': 'v',
                          'bordercolor': '#000000',
                          'borderwidth': 0.7,
                          'itemwidth': 30,
                          'x': 0.01,
                          'y': 1.075,
                          'title': None,
                          'bgcolor':'#F6F5F4'},
               'mapbox': {'style': 'light'},
               'paper_bgcolor': 'white',
               'plot_bgcolor': 'white',
               'polar': {'angularaxis': {'gridcolor': 'white', 'linecolor': 'white', 'ticks': ''},
                         'bgcolor': '#E5ECF6',
                         'radialaxis': {'gridcolor': 'white', 'linecolor': 'white', 'ticks': ''}},
               'scene': {'xaxis': {'backgroundcolor': '#E5ECF6',
                                   'gridcolor': 'white',
                                   'gridwidth': 2,
                                   'linecolor': 'white',
                                   'showbackground': True,
                                   'ticks': '',
                                   'zerolinecolor': 'white'},
                         'yaxis': {'backgroundcolor': '#E5ECF6',
                                   'gridcolor': 'white',
                                   'gridwidth': 2,
                                   'linecolor': 'white',
                                   'showbackground': True,
                                   'ticks': '',
                                   'zerolinecolor': 'white'},
                         'zaxis': {'backgroundcolor': '#E5ECF6',
                                   'gridcolor': 'white',
                                   'gridwidth': 2,
                                   'linecolor': 'white',
                                   'showbackground': True,
                                   'ticks': '',
                                   'zerolinecolor': 'white'}},
               'separators':'.',
               'shapedefaults': {'line': {'color': '#2a3f5f'}},
               'ternary': {'aaxis': {'gridcolor': 'white', 'linecolor': 'white', 'ticks': ''},
                           'baxis': {'gridcolor': 'white', 'linecolor': 'white', 'ticks': ''},
                           'bgcolor': '#E5ECF6',
                           'caxis': {'gridcolor': 'white', 'linecolor': 'white', 'ticks': ''}},
               'title': {'x': 0.5,
                        'font_size':30},
               'xaxis': {'automargin': True,
                         'gridcolor': '#eeeeee',
                         'linecolor': 'white',
                         'ticks': '',
                         'title': {'standoff': 15},
                         'zerolinecolor': 'white',
                         'zerolinewidth': 2},
               'yaxis': {'automargin': True,
                         'gridcolor': '#eeeeee',
                         'linecolor': 'white',
                         'ticks': '',
                         'title': {'standoff': 15},
                         'zerolinecolor': 'white',
                         'zerolinewidth': 2}}
})

pio.templates.default = 'my_theme'

df = pd.DataFrame({'date': {27: '2020-01-28',
  28: '2020-01-29',
  29: '2020-01-30',
  30: '2020-01-31',
  31: '2020-02-01'},
 'new_cases': {27: 2651.0, 28: 589.0, 29: 2068.0, 30: 1692.0, 31: 2111.0},
 'new_cases_smoothed': {27: 717.286,
  28: 801.429,
  29: 1082.857,
  30: 1283.714,
  31: 1515.0}})

fig = px.line(df, x='date', y=['new_cases','new_cases_smoothed'],title='New cases',
              color_discrete_sequence = ['#DB2B39','#0D0628'])
fig.update_traces(hovertemplate=None)
fig.update_layout(hovermode='x unified')#, legend=dict(title=None))
fig.show()
Stepdame answered 20/5, 2021 at 14:58 Comment(2)
I copy and pasted the code you provided on a fresh google colab and it doesn't run. It says ValueError: Invalid properties specified for object of type plotly.graph_objs.layout.Legend: ('itemwidth', 'title') for line 102. It's this line: 'zerolinewidth': 2}}. Could you correct that so we can help you with the legend question?Jellicoe
@KarenPalacio I am unable to recreate the error you're facing. It works fine for me. Maybe check your plotly version? Mine is 4.14.3Stepdame
B
5

This works

fig.update_layout(title_text='ALPACA Queries',
    title_x=0.5, showlegend=True,
    legend_title=None)
Bridgetbridgetown answered 28/11, 2022 at 1:18 Comment(0)
W
2

I was certain that the following would do the trick:

'title': {'text': None}

But to my surprise, the text 'variable' still pops up. An empty string '' doesn't work, and neither does 'title': {'text': False}.

And I find this very interesting, since you're able to edit all other attributes of the legend title except the title text itself. Like color, for example, with:

'title': {'font': {'color':'blue'}}

enter image description here

And this opens up for a sub-optimal solution with:

'title': {'font': {'color':''rgba(0,0,0,0'}}

Which gives you:

enter image description here

But this arguably looks a bit weird since you've still got the extra space for the text. So this seems to be a bug of some kind.

Wyon answered 20/5, 2021 at 21:31 Comment(3)
haha it does look weird with the empty space. I think I'll just resort to manually passing it to each graph until an optimal solution is found.Stepdame
Just found this bug also exists for axis titles defined inside the template. All other properties of the axes work fine, just not the title.Stepdame
If my template defines 'xaxis': {'title': {'text': "ayy"}}, and then I pass fig.update_layout(xaxis=dict(title=None)) or fig.update_xaxes(title=None) along with the graph call. Then, it displays the xaxis title as "ayy". Found this interesting. Seems template property is overridden by graph call and only when you set graph call to None does it reveal the template property hiding underneath.Stepdame
H
2

I am using "plotly-express" and version is "4.14.3".

Here's what has worked for me to actually remove the title:

from plotly import express as px

# make your plot
fig = px.scatter(...)

# udpate the legend's title by setting it to none
fig.update_layout(legend={'title_text':''})
## fig.update_layout({'legend_title_text': ''}) worked too.

# display it
fig.show()
Hurried answered 20/12, 2021 at 11:20 Comment(1)
Yes, well the question was about how to remove it by permanently via a pre-defined template.Stepdame
P
2

The following worked for me with plotly.graph_objects, go.Figure and plotly==5.5.0

fig.update_layout(
    title="Performance Results",
    legend_title="",
    ...,
)
Pleuropneumonia answered 31/1, 2022 at 5:53 Comment(1)
I am aware of this method, it's mentioned in the question itself. I was looking for a way to change the default setting in the template, not to pass it to each figure.Stepdame

© 2022 - 2024 — McMap. All rights reserved.