AWS CloudWatch Logs metrics broken graph
A

3

7

We've configured a metric filter for a CloudWatch Log Group which collects data for one of our processes.

Initially, we had only one ec2 instance associated with the log stream of the log group. The retrieved data from the logs was showing up nicely in the graph.

However, we want to have multiple instances connected to that same log stream or log group. When we configured another instance for the log group, the graph becomes broken:

Broken-Graph

From what we observed, it looks like the points are only connected if they are consecutive data derived from the latest instance. Otherwise, it just shows a point.

All the data shown are still correct. It's just that they aren't all connected. Is there a way to have all the points connect?

Axel answered 20/7, 2017 at 16:44 Comment(0)
M
4

This is the way CloudWatch graphs communicate the fact that your datapoints are not continuous. There is no way to force the connection between datapoints.

-- update 2022-5-31 --

The above is still the correct answer. There is no way to connect the datapoints with a gap between them with just a line. If there is a gap in the line that means the data for that timestamp doesn't exist. This could happen if the event you're measuring with the graph never happened or there was an issue with publishing the metric. Both of these are valid scenarios.

However, CloudWatch launched the metric math feature in April 2018 and one of the functions supported with the metric math is FILL (see the answer below of this answer on how to use it).

FILL doesn't just connect the lines to make the graph pretty. It will actually interpolate the missing values and insert them into the graph (only the graph, not the actual datastore). This hides the above-mentioned scenarios of missing data. This could be fine, but it could also cause issues and unpredicted behavior depending on the use case. I'd suggest to use the FILL function carefully and always making it clear on the graph (in the title or the legend) that the FILL was used in the graph.

Merry answered 21/7, 2017 at 20:5 Comment(0)
G
7

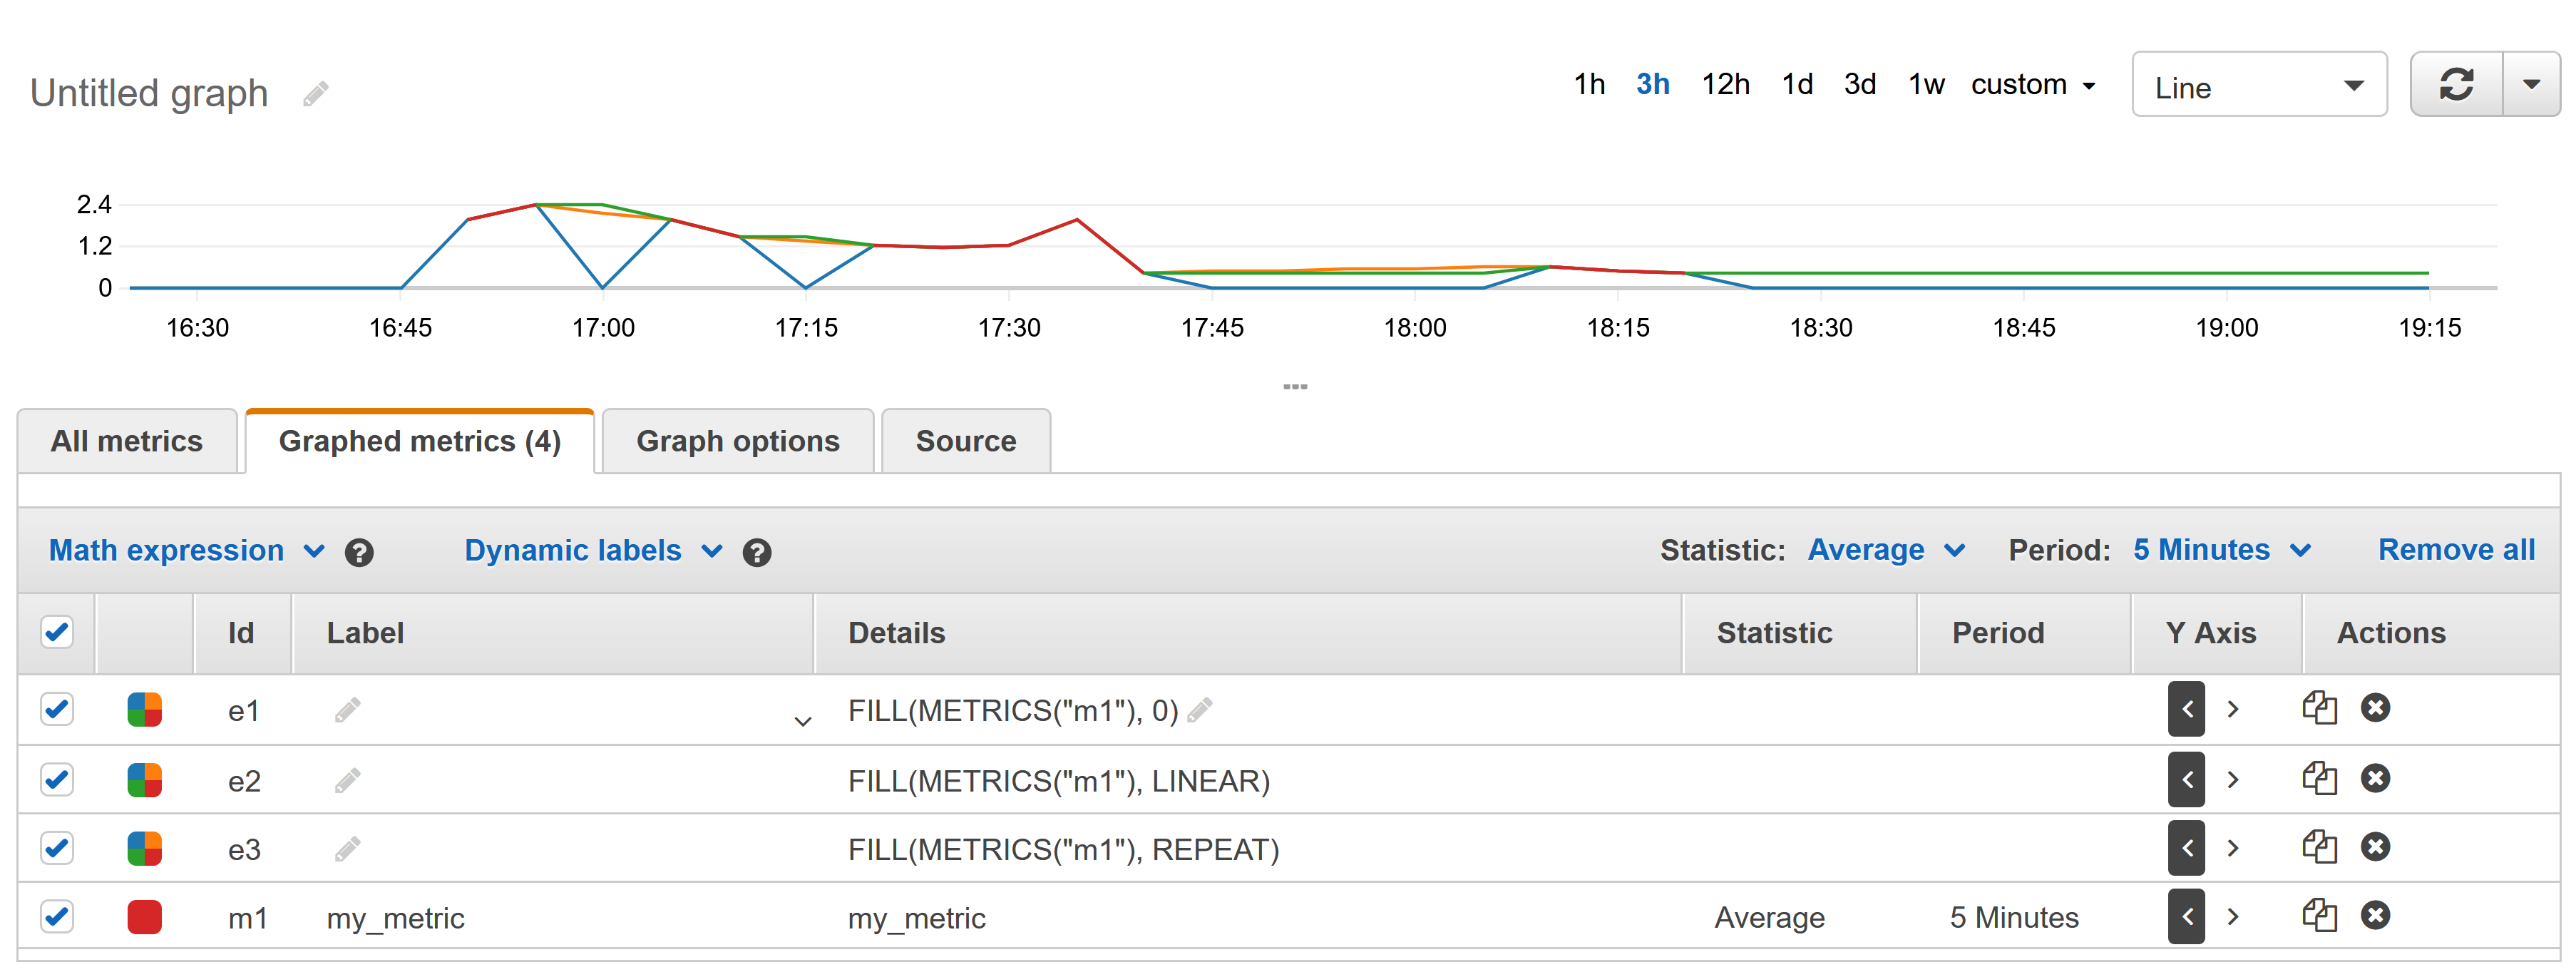
This might be a recently-added feature, but there actually is a way to force connections between discontinuous data points in a CloudWatch graph: you can use metric math. There is a 'FILL' expression which fills gaps in a time series.

You can add a metric math expression with the 'Math expression' button in the 'edit graph' UI:

cloudwatch_gaps

The red lines represent some intermittent data points, and the 'FILL' expression gives you three options for how to fill in the gaps:

  • A scalar will fill the gaps with a constant value (blue line, gaps set to 0).

  • LINEAR will perform a linear interpolation between the two points on either side of a gap (orange line).

  • REPEAT will repeat the last received data point until a new one arrives (green line).

Once you're happy with the gap-filling behavior, you can un-check the original metric's row in the table to hide it when the graph is displayed.

Galangal answered 20/9, 2021 at 19:48 Comment(1)
Nice. This should be updated to be the accepted answer.Selfgoverned
M
4

This is the way CloudWatch graphs communicate the fact that your datapoints are not continuous. There is no way to force the connection between datapoints.

-- update 2022-5-31 --

The above is still the correct answer. There is no way to connect the datapoints with a gap between them with just a line. If there is a gap in the line that means the data for that timestamp doesn't exist. This could happen if the event you're measuring with the graph never happened or there was an issue with publishing the metric. Both of these are valid scenarios.

However, CloudWatch launched the metric math feature in April 2018 and one of the functions supported with the metric math is FILL (see the answer below of this answer on how to use it).

FILL doesn't just connect the lines to make the graph pretty. It will actually interpolate the missing values and insert them into the graph (only the graph, not the actual datastore). This hides the above-mentioned scenarios of missing data. This could be fine, but it could also cause issues and unpredicted behavior depending on the use case. I'd suggest to use the FILL function carefully and always making it clear on the graph (in the title or the legend) that the FILL was used in the graph.

Merry answered 21/7, 2017 at 20:5 Comment(0)
A
1

For the benefit of others who may come across this question, in the context of training deep neural networks, I have found that changing the Period value to a larger value caused the points to connect (I changed it from 5 Seconds to 15 Minutes).

Ache answered 4/12, 2019 at 20:1 Comment(2)
This answer looks more like a comment to me.Mckenney
Agreed! But I do not use Stack Overflow enough to be able to add comments (I guess except here!)Ache

© 2022 - 2024 — McMap. All rights reserved.