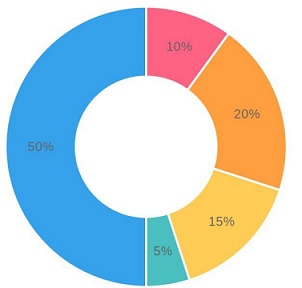
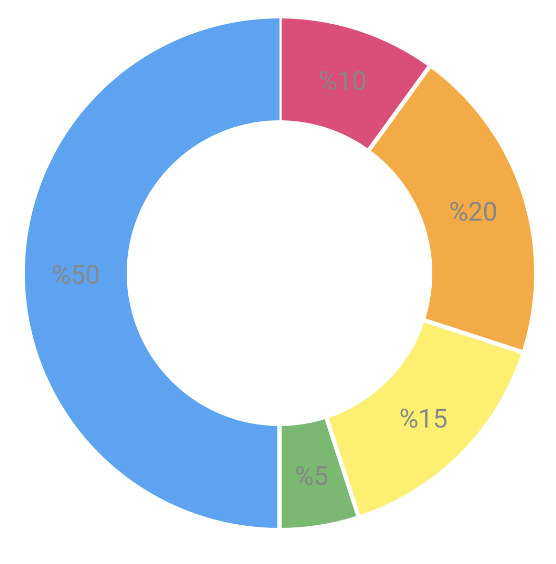
Result
![enter image description here]()
You can achieve this using TextMeasurer to measure text for each value as
    val textMeasurer = rememberTextMeasurer()
    val textMeasureResults = remember(chartDataList) {
        chartDataList.map {
            textMeasurer.measure(
                text = "%${it.data.toInt()}",
                style = TextStyle(
                    fontSize = 18.sp
                )
            )
        }
    }
Then draw Text using cos and sin with degrees in radian as
drawText(
    textLayoutResult = textMeasureResult,
    color = Color.Gray,
    topLeft = Offset(
        -textCenter.x + center.x + (innerRadius + strokeWidth / 2) * cos(
            angleInRadians
        ),
        -textCenter.y + center.y + (innerRadius + strokeWidth / 2) * sin(
            angleInRadians
        )
    )
)

startAngle += sweepAngle
Full implementation
@Preview
@Composable
private fun PieChartWithText() {

    Box(
        modifier = Modifier
            .fillMaxSize()
            .padding(20.dp),
        contentAlignment = Alignment.Center
    ) {
        val chartDataList = listOf(
            ChartData(Pink400, 10f),
            ChartData(Orange400, 20f),
            ChartData(Yellow400, 15f),
            ChartData(Green400, 5f),
            ChartData(Blue400, 50f),
        )

        val textMeasurer = rememberTextMeasurer()
        val textMeasureResults = remember(chartDataList) {
            chartDataList.map {
                textMeasurer.measure(
                    text = "%${it.data.toInt()}",
                    style = TextStyle(
                        fontSize = 18.sp
                    )
                )
            }
        }

        Canvas(
            modifier = Modifier
                .fillMaxWidth()
                .aspectRatio(1f)
        ) {
            val width = size.width
            val radius = width / 2f
            val strokeWidth = radius * .4f
            val innerRadius = radius - strokeWidth
            val lineStrokeWidth = 3.dp.toPx()

            var startAngle = -90f

            for (index in 0..chartDataList.lastIndex) {

                val chartData = chartDataList[index]
                val sweepAngle = chartData.data.asAngle
                val angleInRadians = (startAngle + sweepAngle / 2).degreeToAngle
                val textMeasureResult = textMeasureResults[index]
                val textSize = textMeasureResult.size

                drawArc(
                    color = chartData.color,
                    startAngle = startAngle,
                    sweepAngle = sweepAngle,
                    useCenter = false,
                    topLeft = Offset(strokeWidth / 2, strokeWidth / 2),
                    size = Size(width - strokeWidth, width - strokeWidth),
                    style = Stroke(strokeWidth)
                )

                rotate(
                    90f + startAngle
                ) {
                    drawLine(
                        color = Color.White,
                        start = Offset(radius, strokeWidth),
                        end = Offset(radius, 0f),
                        strokeWidth = lineStrokeWidth
                    )
                }

                val textCenter = textSize.center

    drawText(
        textLayoutResult = textMeasureResult,
        color = Color.Gray,
        topLeft = Offset(
            -textCenter.x + center.x + (innerRadius + strokeWidth / 2) * cos(
                angleInRadians
            ),
            -textCenter.y + center.y + (innerRadius + strokeWidth / 2) * sin(
                angleInRadians
            )
        )
    )

    startAngle += sweepAngle
            }
        }
    }
}

private val Float.degreeToAngle
    get() = (this * Math.PI / 180f).toFloat()

private val Float.asAngle: Float
    get() = this * 360f / 100f

@Immutable
data class ChartData(val color: Color, val data: Float)
Also easy to animate chart on composition with a slight change
![enter image description here]()
@Preview
@Composable
private fun AnimatedChart() {

    val animatable = remember {
        Animatable(-90f)
    }

    val finalValue = 270f

    LaunchedEffect(key1 = animatable) {
        animatable.animateTo(
            targetValue = finalValue,
            animationSpec = tween(
                delayMillis = 4000,
                durationMillis = 2000
            )
        )
    }
    val currentSweepAngle = animatable.value


    Box(
        modifier = Modifier
            .fillMaxSize()
            .padding(20.dp),
        contentAlignment = Alignment.Center
    ) {
        val chartDataList = listOf(
            ChartData(Pink400, 10f),
            ChartData(Orange400, 20f),
            ChartData(Yellow400, 15f),
            ChartData(Green400, 5f),
            ChartData(Blue400, 50f),
        )

        val textMeasurer = rememberTextMeasurer()
        val textMeasureResults = remember(chartDataList) {
            chartDataList.map {
                textMeasurer.measure(
                    text = "%${it.data.toInt()}",
                    style = TextStyle(
                        fontSize = 18.sp
                    )
                )
            }
        }

        Canvas(
            modifier = Modifier
                .fillMaxWidth()
                .aspectRatio(1f)
        ) {
            val width = size.width
            val radius = width / 2f
            val strokeWidth = radius * .4f
            val innerRadius = radius - strokeWidth
            val lineStrokeWidth = 3.dp.toPx()

            var startAngle = -90f

            for (index in 0..chartDataList.lastIndex) {

                val chartData = chartDataList[index]
                val sweepAngle = chartData.data.asAngle
                val angleInRadians = (startAngle + sweepAngle / 2).degreeToAngle
                val textMeasureResult = textMeasureResults[index]
                val textSize = textMeasureResult.size

                if (startAngle <= currentSweepAngle) {
                    drawArc(
                        color = chartData.color,
                        startAngle = startAngle,
                        sweepAngle = sweepAngle.coerceAtMost(currentSweepAngle - startAngle),
                        useCenter = false,
                        topLeft = Offset(strokeWidth / 2, strokeWidth / 2),
                        size = Size(width - strokeWidth, width - strokeWidth),
                        style = Stroke(strokeWidth)
                    )
                }

                rotate(
                    90f + startAngle
                ) {
                    drawLine(
                        color = Color.White,
                        start = Offset(radius, strokeWidth),
                        end = Offset(radius, 0f),
                        strokeWidth = lineStrokeWidth
                    )
                }

                val textCenter = textSize.center

                if (currentSweepAngle == finalValue) {
                    drawText(
                        textLayoutResult = textMeasureResult,
                        color = Brown400,
                        topLeft = Offset(
                            -textCenter.x + center.x + (innerRadius + strokeWidth / 2) * cos(
                                angleInRadians
                            ),
                            -textCenter.y + center.y + (innerRadius + strokeWidth / 2) * sin(
                                angleInRadians
                            )
                        )
                    )
                }

                startAngle += sweepAngle
            }
        }
    }
}


textMeasurer.measure( text = buildAnnotatedString { append("%${it.data.toInt()}")},– Trusty