Beautifying Sankey/Alluvial visualization using R
Asked Answered
C

1

7

I'm currently using Alluvial package in R to create a visualization.

Here is my data set:

https://app.box.com/s/6qju42u0cg1cmrnhyhyzmjtp59wnsn3q

Here is my code:

alluvial(fb_ad_3d[,2:3], freq=fb_ad_3d$freq,
         col = ifelse( fb_ad_3d$Response == "Yes", "skyblue1", 
                       "darkorchid1" ),xw = 0.2,alpha = 0.6,
                        gap.width=0.2,cex = 1.1, cex.axis = 1.5)

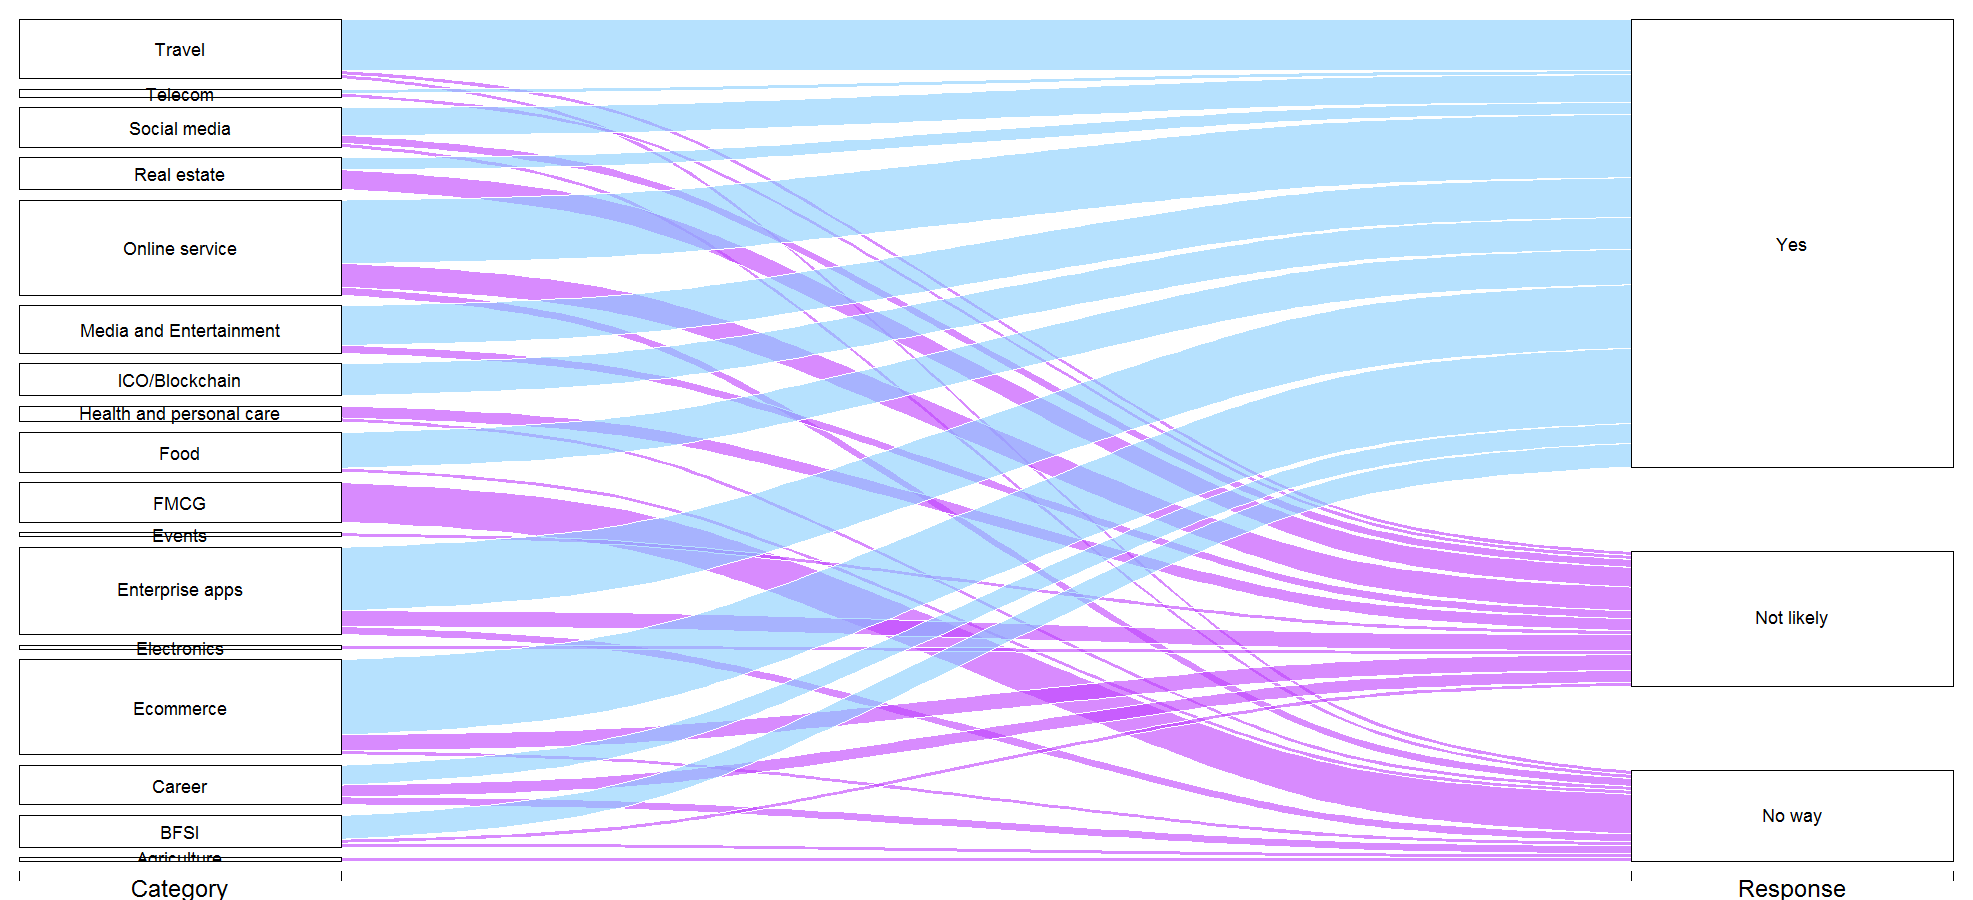
Here is the visualization:

enter image description here

There are two thing I really don't like:

  1. The zigzag patterns on the edges of the flow connectors

  2. Certain categories (Agriculture, Events, Electronics, Telecom) on the left side have been compressed making them ineligible.

Any way to improve this visualization and make it beautiful?

Cruikshank answered 17/5, 2018 at 15:18 Comment(2)
Have you tried the ggalluvial package?Hey
I've not yet tried that package.Cruikshank
C
14

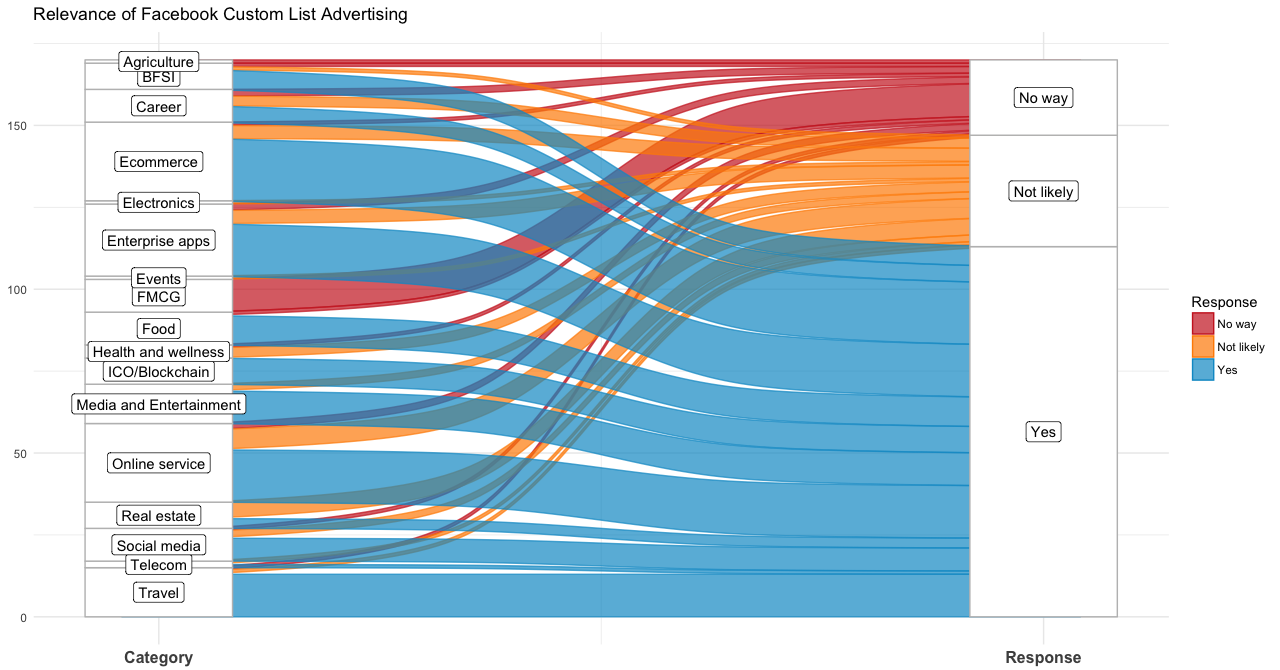
Tried out ggalluvial package. The result is much better.

Here is the code:

A_col <- "firebrick3"
B_col <- "darkorange"
C_col <- "deepskyblue3"
alpha <- 0.7

ggplot(fb_ad_3d,
       aes(weight = freq, axis1 = Category, axis2 = Response)) +
  geom_alluvium(aes(fill = Response, color = Response), 
                width = 1/12, alpha = alpha, knot.pos = 0.4) +
  geom_stratum(width = 1/6, color = "grey") +
  geom_label(stat = "stratum", label.strata = TRUE) +
  scale_x_continuous(breaks = 1:2, labels = c("Category", "Response"))     +
  scale_fill_manual(values  = c(A_col, B_col, C_col)) +
  scale_color_manual(values = c(A_col, B_col, C_col)) +
  ggtitle("Relevance of Facebook Custom List Advertising") +
  theme_minimal() +
  theme(
   axis.text.x = element_text(size = 12, face = "bold")
  )

Here is the visualization:

enter image description here

Cruikshank answered 17/5, 2018 at 20:7 Comment(3)
Hi @user709413. This is cool. Thanks! Any way to get rid of the legend? I tried the usual solutions but they are not working, not sure why. Also, how to remove the grids that are not directly related to the plot?Cryotherapy
Try to use the following: theme( legend.position = "none", panel.grid.major = element_blank(), panel.grid.minor = element_blank(), axis.text.y = element_blank(), axis.text.x = element_text(size = 12, face = "bold") )Cruikshank
Thanks, @user709413. Just tried the new theme and it improves tremendously the visual.Cryotherapy

© 2022 - 2024 — McMap. All rights reserved.