How to use Flutter's Widget Inspector in Visual Studio Code?
Asked Answered
H

3

7

How do you use the Flutter Widget Inspector introduced in VSCode and now enabled? When I debug the app from the IDE or Terminal, nothing happens when I click on any widget in the iOS simulator. I could not find any info on VSCode from Google.

I am on MacOS Sierra.

Haarlem answered 19/11, 2018 at 19:40 Comment(0)
E
5

When debugging, run command Flutter: Inspect Widget, then click on the UI/Widget, it will auto lead you to the code which generates the widget. It only works in debugging mode and the command is not available until the app is loaded in debug. enter image description here

Endospore answered 19/11, 2018 at 21:23 Comment(3)
Thank you - my problem was debugging from Terminal and thinking VSCode could attach automatically, it doesn't appear to be the case. It must be debugged within the IDE.Haarlem
Yes, it appears to be only working when you debug from IDE for now. Maybe that's something Dart/Flutter plugin can be improved in the future.Endospore
Unfortunately this command can only run when VS Code has a connection to the debugger. This means you either need to launch it from VS Code or use the Debug: Attach to Flutter Process command. Generally, I would recommend always debugging from VS Code rather than the terminal, as there are other features you'll miss (like hot-reload-on-save) if you don't :-)Witmer
W
9

As of v2.24, the Dart extension for VS Code has integration with the Dart DevTools. This has much better inspector functionality than the original Inspect Widget command mentioned by stt106's.

With a debugging session active, open the command palette and find the DevTools command.

The first time you run this you'll may be prompted to activate or upgrade.

DevTools will then launch in your browser and connect to your debug session.

There's more info on the functionality of Dart's DevTools in the DevTools docs.

Witmer answered 4/3, 2019 at 21:10 Comment(0)
E
5

When debugging, run command Flutter: Inspect Widget, then click on the UI/Widget, it will auto lead you to the code which generates the widget. It only works in debugging mode and the command is not available until the app is loaded in debug. enter image description here

Endospore answered 19/11, 2018 at 21:23 Comment(3)
Thank you - my problem was debugging from Terminal and thinking VSCode could attach automatically, it doesn't appear to be the case. It must be debugged within the IDE.Haarlem
Yes, it appears to be only working when you debug from IDE for now. Maybe that's something Dart/Flutter plugin can be improved in the future.Endospore
Unfortunately this command can only run when VS Code has a connection to the debugger. This means you either need to launch it from VS Code or use the Debug: Attach to Flutter Process command. Generally, I would recommend always debugging from VS Code rather than the terminal, as there are other features you'll miss (like hot-reload-on-save) if you don't :-)Witmer
G
0

Updated method:

As of Dart Code (VS code extension) version 2.24.0, The 'Flutter: Inspect Widget' command was replaced with DevTools. (at the time of writing this, the latest version is 3.36.0. To get to the Inspect Widget from the command pallet with >Flutter: Open DevTools or >Dart: Open DevTools, requires several steps.

Here's a quicker way:

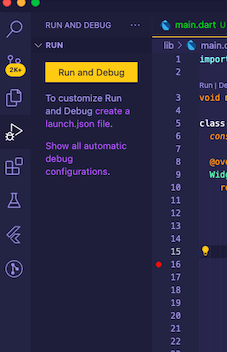
  Click the debug (bug) button from the side menu and Select Run and Debug or press f5

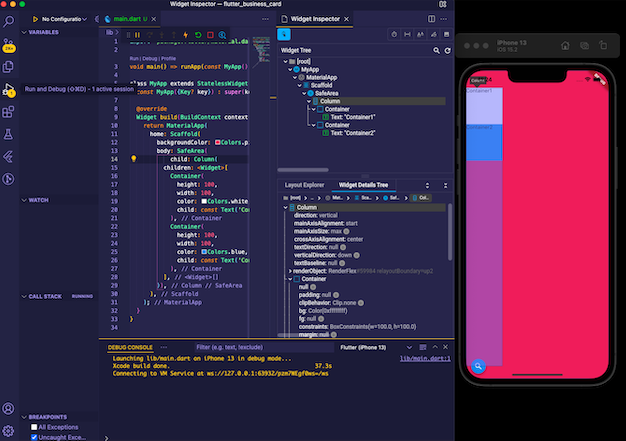
The Widget inspector will open automatically. Screenshot of side menu

Screenshot of emulator using the Flutter Widget inspector enter image description here

Guacin answered 20/3, 2022 at 12:54 Comment(0)

© 2022 - 2024 — McMap. All rights reserved.