How to modify messy and overlapping date labels below x axis
Asked Answered
A

3

7

df (Pandas DataFrame) has two columns: Date (as datetime64) and Amount (as float).

I plot the values from Amount column against time, using barplot:

sns.barplot(x="Date", y="Amount", data=df)
plt.show()

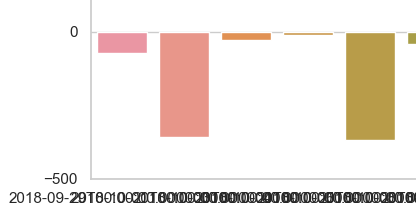
However, the date labels are a terrible mess (see picture). What would be an elegant way of dealing with this in Pandas? I'm considering removing month and year from the label, or rotating the labels 90 degrees. How would these be done, or is there a better option? Thank you.

Overlapping date labels on x axis

Aurochs answered 28/11, 2018 at 21:3 Comment(4)
Possible duplicate of Rotate label text in seaborn factorplotCulminate
Rotating the label revealed that barplot shows the date labes in the following format: "2018-09-29T00:00:00.000000000", even though print(df["Date"] shows them in the correct format (2018-09-29) (no idea why?). This is one reason for the mess, but I think the original question still stands.Aurochs
that's definitely a separate question, "how can I get pandas to format my datetimes as dates" (which most likely also has answers here already -- naively, you could just use strftime mapped over your df rows).Culminate
Sure that's a separate question, but doing that (with the help of the other reply) did not fully solve the problem of messy labels. Rotating helped some, smaller font helped a bit more, and finally displaying only the day (instead of date) made the labels readable. Thanks.Aurochs
K
4

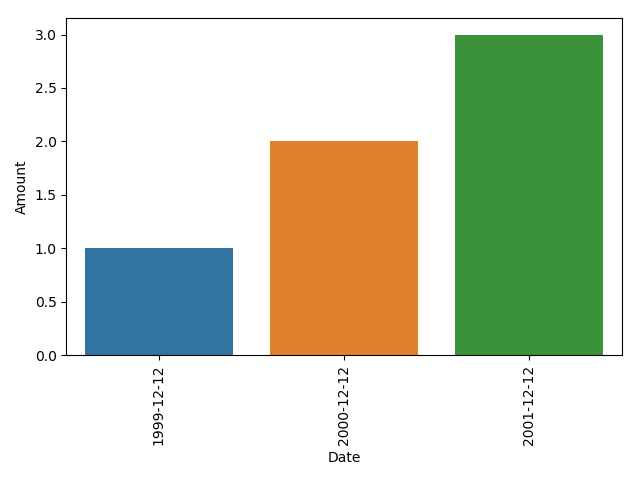
I would do both: rotate your xlabels and use only the dates:

import seaborn as sns
import matplotlib.pyplot as plt

# dummy data:
df = pd.DataFrame({'Date':pd.to_datetime(['1999-12-12', '2000-12-12', '2001-12-12']),'Amount':[1,2,3]})

sns.barplot(x="Date", y="Amount", data=df)
# use the original locations of your xticks, and only the date for your label
# rotate the labels 90 degrees using the rotation argument
plt.xticks(plt.xticks()[0], df.Date.dt.date, rotation=90)
plt.tight_layout()
plt.show()

enter image description here

Koster answered 28/11, 2018 at 21:8 Comment(2)
Thank you, this cleaned up the label very nicely. I'm not exactly sure what "plt.xticks()[0]" does, and should I call these date labels xticks or labels or something else?Aurochs
plt.xticks()[0] is one way to get the tick locations of your current plot (there are other ways, too). So you pass your original tick locations, your labels as formatted strings, and the desired rotation to the xticks attributeKoster
S
8

This automatically adjusts SNS plot's date x axis so you don't have to manually do this in most cases: sns_plot.get_figure().autofmt_xdate()

Snowslide answered 30/8, 2020 at 5:32 Comment(3)
Include full body of code in answer. "sns_plot" is a local variable you have created as a return from the seaborn plot function. This modification changed the angle of datetimes but it does not eliminate time information if that is also causing overlap.Numeral
Underrated answerRosanne
This solves my problem. Thanks!!Dalessio
K
4

I would do both: rotate your xlabels and use only the dates:

import seaborn as sns
import matplotlib.pyplot as plt

# dummy data:
df = pd.DataFrame({'Date':pd.to_datetime(['1999-12-12', '2000-12-12', '2001-12-12']),'Amount':[1,2,3]})

sns.barplot(x="Date", y="Amount", data=df)
# use the original locations of your xticks, and only the date for your label
# rotate the labels 90 degrees using the rotation argument
plt.xticks(plt.xticks()[0], df.Date.dt.date, rotation=90)
plt.tight_layout()
plt.show()

enter image description here

Koster answered 28/11, 2018 at 21:8 Comment(2)
Thank you, this cleaned up the label very nicely. I'm not exactly sure what "plt.xticks()[0]" does, and should I call these date labels xticks or labels or something else?Aurochs
plt.xticks()[0] is one way to get the tick locations of your current plot (there are other ways, too). So you pass your original tick locations, your labels as formatted strings, and the desired rotation to the xticks attributeKoster
T
2

Another solution, if you have a large number of dates and would prefer to label them at a more sparse interval;

import pandas as pd
import seaborn as sns
import matplotlib.pyplot as plt
import matplotlib.dates as mdates

# dummy data:
df = pd.DataFrame({'Date':pd.to_datetime(['1999-12-12', '2000-12-12', '2001-12-12',
                                          '2002-12-12', '2003-12-12', '2004-12-12',
                                          '2005-12-12','2006-12-12', '2007-12-12', '2008-12-12']),
                                          'Amount':[1,2,3,4,5,6,7,8,9,10]})

fig, ax = plt.subplots()
sns.barplot(x="Date", y="Amount", data=df, ax=ax)

# set the frequency for labelling the xaxis
freq = int(2)

# set the xlabels as the datetime data for the given labelling frequency,
# also use only the date for the label
ax.set_xticklabels(df.iloc[::freq].Date.dt.date)
# set the xticks at the same frequency as the xlabels
xtix = ax.get_xticks()
ax.set_xticks(xtix[::freq])
# nicer label format for dates
fig.autofmt_xdate()

plt.tight_layout()
plt.show()

Click to see plot

It's also worth considering using the seaborn plot defaults, and placing the dates on the yaxis for ease of reading, but that's moreso personal preference.

import pandas as pd
import seaborn as sns
import matplotlib.pyplot as plt
import matplotlib.dates as mdates

# set the seaborn asthetics
sns.set()

# dummy data:
df = pd.DataFrame({'Date':pd.to_datetime(['1999-12-12', '2000-12-12', '2001-12-12',
                                          '2002-12-12', '2003-12-12', '2004-12-12',
                                          '2005-12-12','2006-12-12', '2007-12-12', '2008-12-12']),
                                          'Amount':[1,2,3,4,5,6,7,8,9,10]})

fig, ax = plt.subplots()
# plot with a horizontal orientation
sns.barplot(y="Date", x="Amount", data=df, ax=ax, orient='h')

# set the frequency for labelling the yaxis
freq = int(2)

# set the ylabels as the datetime data for the given labelling frequency,
# also use only the date for the label
ax.set_yticklabels(df.iloc[::freq].Date.dt.date)
# set the yticks at the same frequency as the ylabels
ytix = ax.get_yticks()
ax.set_yticks(ytix[::freq])

plt.tight_layout()
plt.show()

Click to see nicer plot

Taxiway answered 23/3, 2019 at 3:29 Comment(0)

© 2022 - 2024 — McMap. All rights reserved.