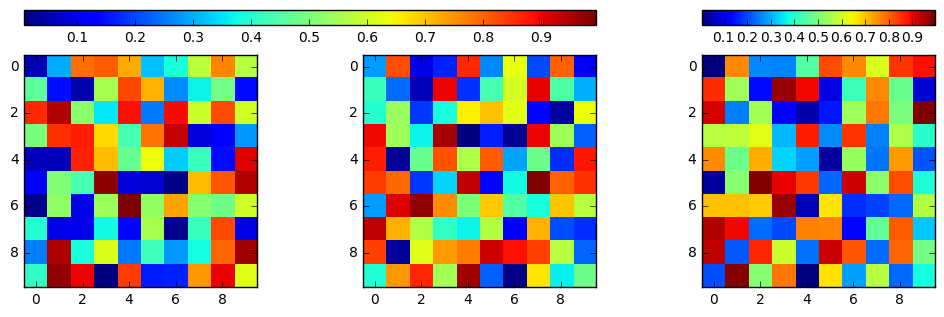
The idea is to use fig.add_axes to add the axes where the colorbar will be.
Here's an example:
import numpy as np
import matplotlib.pyplot as plt

matrix = np.random.random((10, 10, 3))

fig, ax = plt.subplots(1,3, figsize=(12, 3))
plt.subplots_adjust(left=0.05, right=0.85)
for i in range(3):
    im = ax[i].imshow(matrix[:, :, i], interpolation='nearest')
    ax[i].set_aspect("equal")

plt.draw()
p0 = ax[0].get_position().get_points().flatten()
p1 = ax[1].get_position().get_points().flatten()
p2 = ax[2].get_position().get_points().flatten()
ax_cbar = fig.add_axes([p0[0], 0, p1[2]-p0[0], 0.05])
plt.colorbar(im, cax=ax_cbar, orientation='horizontal')

ax_cbar1 = fig.add_axes([p2[0], 0, p2[2]-p2[0], 0.05])
plt.colorbar(im, cax=ax_cbar1, orientation='horizontal')

plt.show()
![example_colorbar]()
Edit:
The documentation of fig.add_axes say:
Add an axes at position rect [left, bottom, width,
height] where all quantities are in fractions of figure
width and height.
So to put the colorbar on top of the graphs you only need to change the bottom argumen to 1.
From
ax_cbar = fig.add_axes([p0[0], 0, p1[2]-p0[0], 0.05])
ax_cbar1 = fig.add_axes([p2[0], 0, p2[2]-p2[0], 0.05])
to
ax_cbar = fig.add_axes([p0[0], 1, p1[2]-p0[0], 0.05])
ax_cbar1 = fig.add_axes([p2[0], 1, p2[2]-p2[0], 0.05])
![enter image description here]()


