I've been experimenting with Seaborn's lmplot() and Statsmodels .ols() functions for simple linear regression plots and their associated p-values, r-squared, etc.
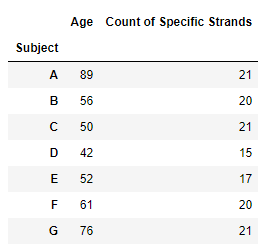
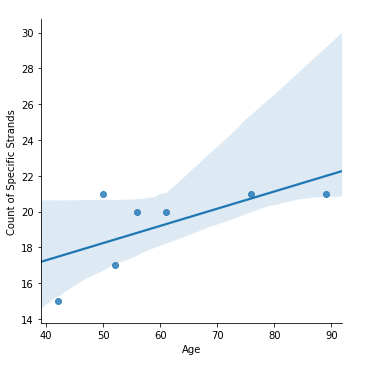
I've noticed that when I specify which columns I want to use for lmplot, I can specify a column even if it has multiple words for it:
import seaborn as sns
import pandas as pd
input_csv = pd.read_csv('./test.csv',index_col = 0,header = 0)
input_csv
sns.lmplot(x='Age',y='Count of Specific Strands',data = input_csv)
<seaborn.axisgrid.FacetGrid at 0x2800985b710>
However, if I try to use ols, I'm getting an error for inputting in "Count of Specific Strands" as my dependent variable (I've only listed out the last couple of lines in the error):
import statsmodels.formula.api as smf
test_results = smf.ols('Count of Specific Strands ~ Age',data = input_csv).fit()

File "<unknown>", line 1
    Count of Specific Strands
           ^
SyntaxError: invalid syntax
Conversely, if I specify the "Counts of Specific Strand" as shown below, the regression works:
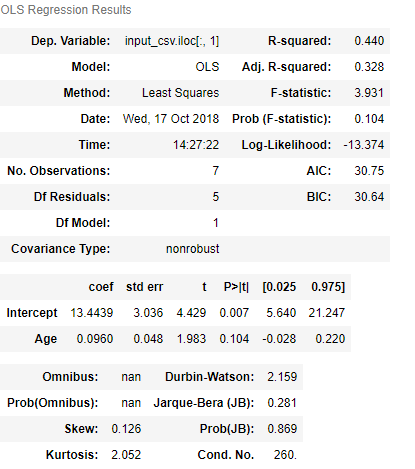
test_results = smf.ols('input_csv.iloc[:,1] ~ Age',data = input_csv).fit()
test_results.summary()
Does anyone know why this is? Is it just because of how Statsmodels was written? Is there an alternative to specify the dependent variable for regression analysis that doesn't involve iloc or loc?


