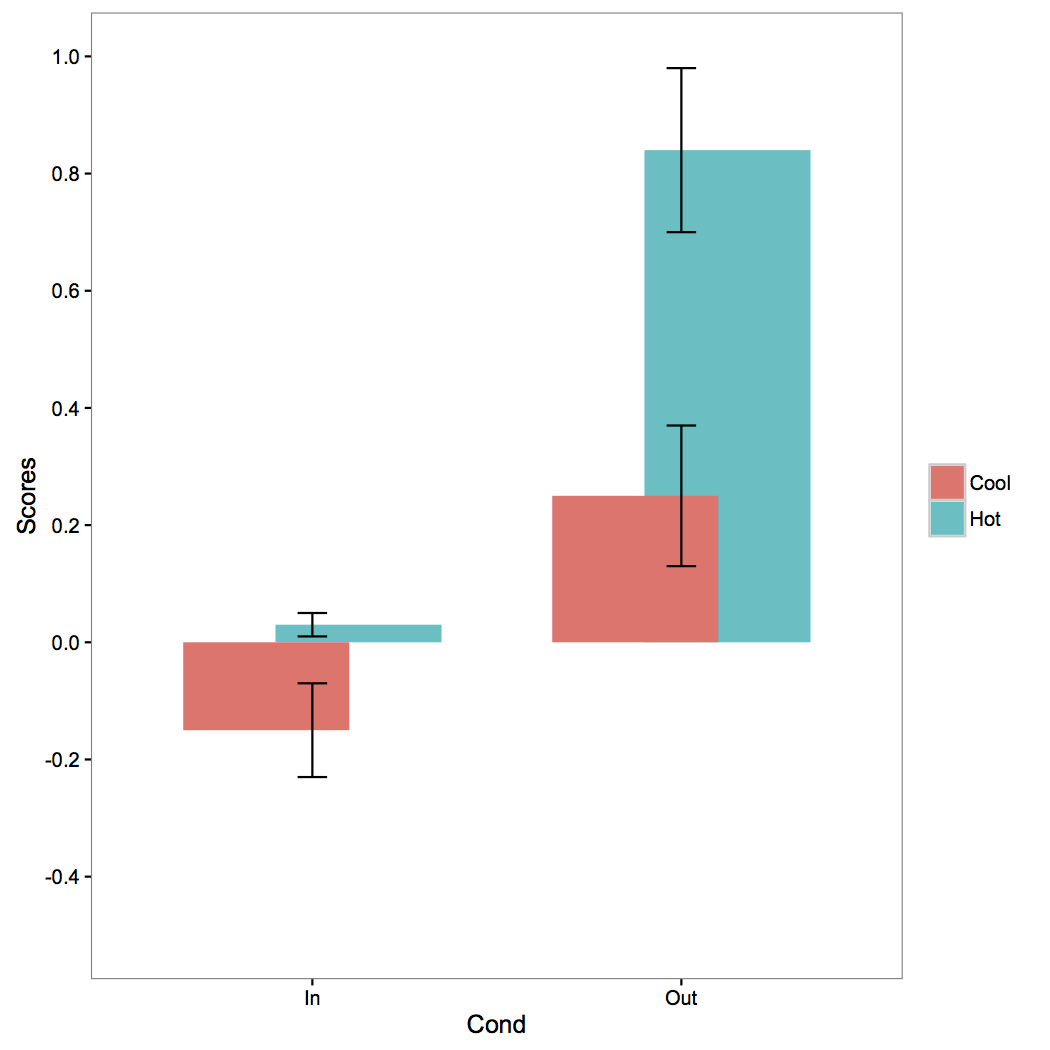
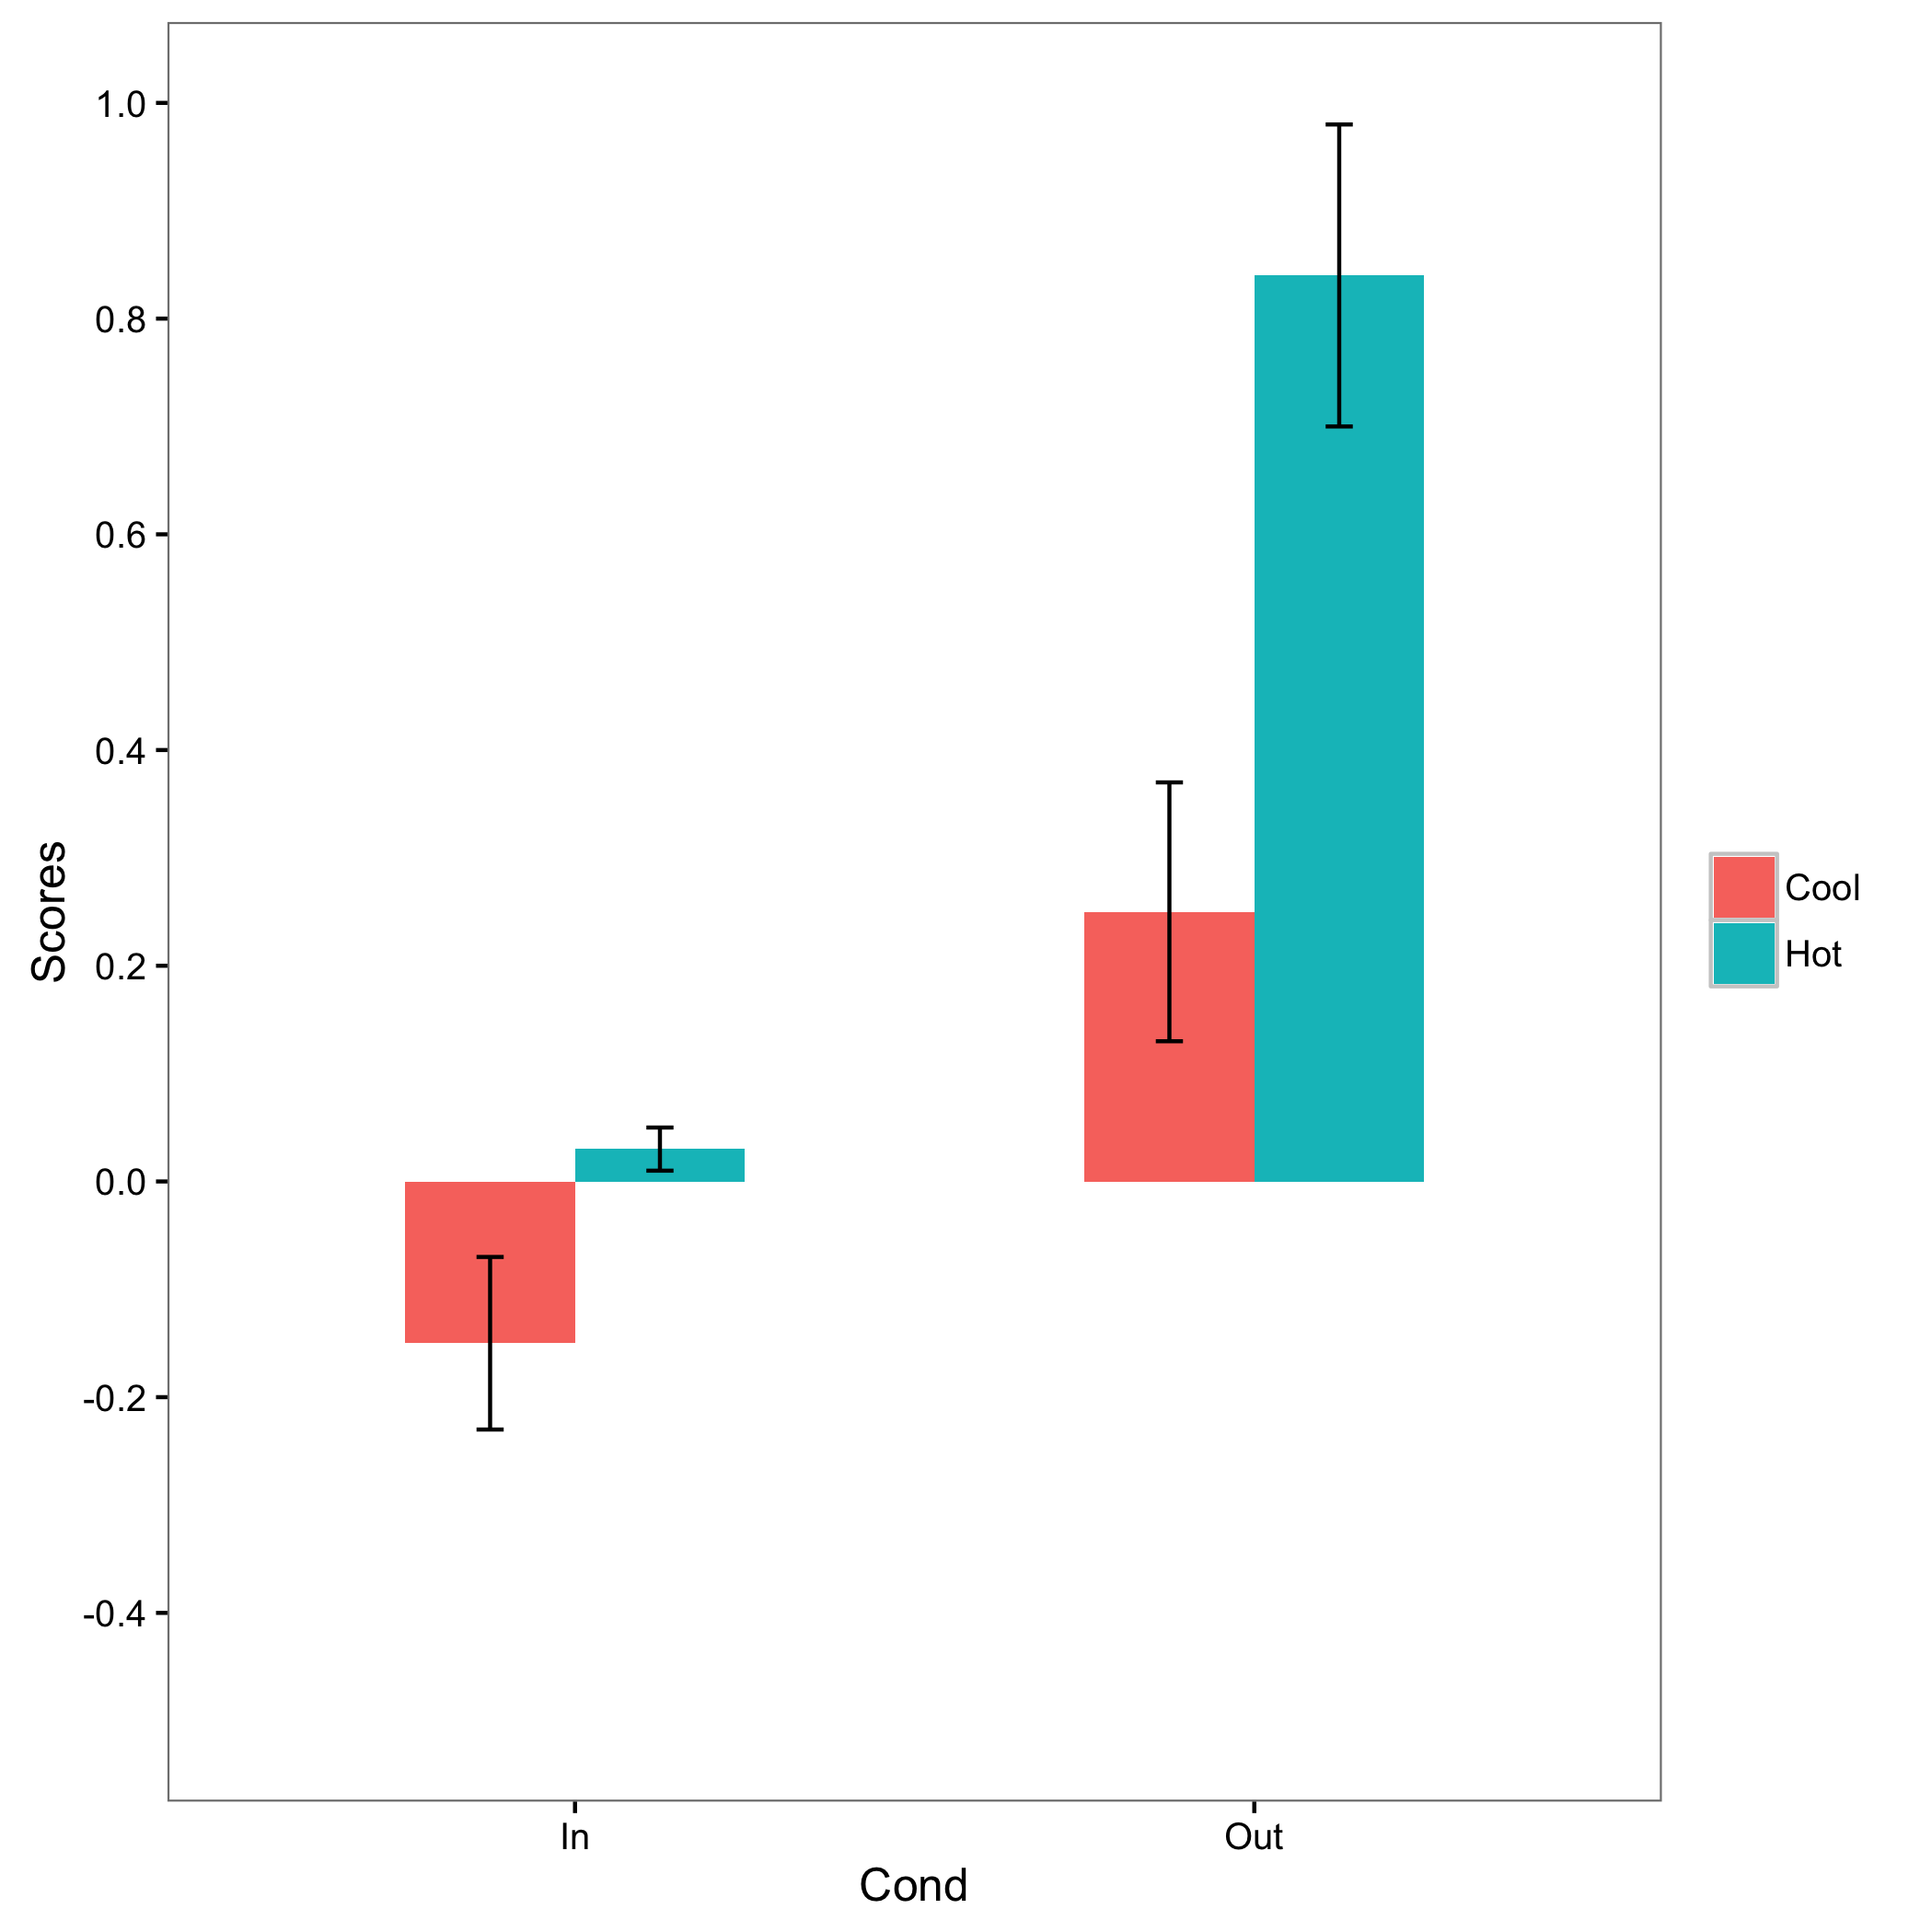
I am having a problem with my bar chart- the error bars just appear on the corner of the columns of the grouping variable rather than on them in a centralised way. The code I am using is this:
a <- data.frame (Cond = c("In", "In", "Out", "Out"),
                Temp = c("Hot", "Cool", "Hot", "Cool"),
                Score = c(.03, -.15, 0.84, 0.25),
                SE = c(.02, .08, .14, .12))
a.bar <- ggplot (data = a, aes(x = Cond, y = Score, fill = Temp)) +
            theme_bw() + theme(panel.grid = element_blank ()) +
            coord_cartesian (ylim = c(-0.5, 1)) +
            geom_bar (aes(fill = Temp), stat = "identity", position = "dodge", width = .5) +
            geom_errorbar (aes(ymin = Score - SE, ymax = Score + SE, group = Cond), position = position_dodge(.9), width = .08) +
            labs(y = "Scores" , x = "Cond") +
            scale_y_continuous (breaks = pretty_breaks(n=8)) +
            theme(legend.title = element_blank()) +
            theme(legend.position = "right")
The alternative codes I have tried, which I couldn't get to work either, included adding "show.legend = FALSE" to geom_bar(); adding "facet_wrap(~Cond)" plot.a; and introducing "fill = Temp" within ggplot(aes()). The closest solution was when I changed the position_dodge() argument into:
geom_bar (aes(fill = Temp), stat = "identity", position = position_dodge(width = .5)) +
geom_errorbar (aes(ymin = Score - SE, ymax = Score + SE, group = Cond), position = position_dodge(.5), width = .08) +
(the rest of the code remains the same). This moved the error bars towards the center of the columns, yet also moved the columns towards each other, eventually making them overlap (see attached figure).

I would very much appreciate help on this.
Thanks!


fillshould be irrelevant), but this is crucial and not super intuitive. – Vicarious