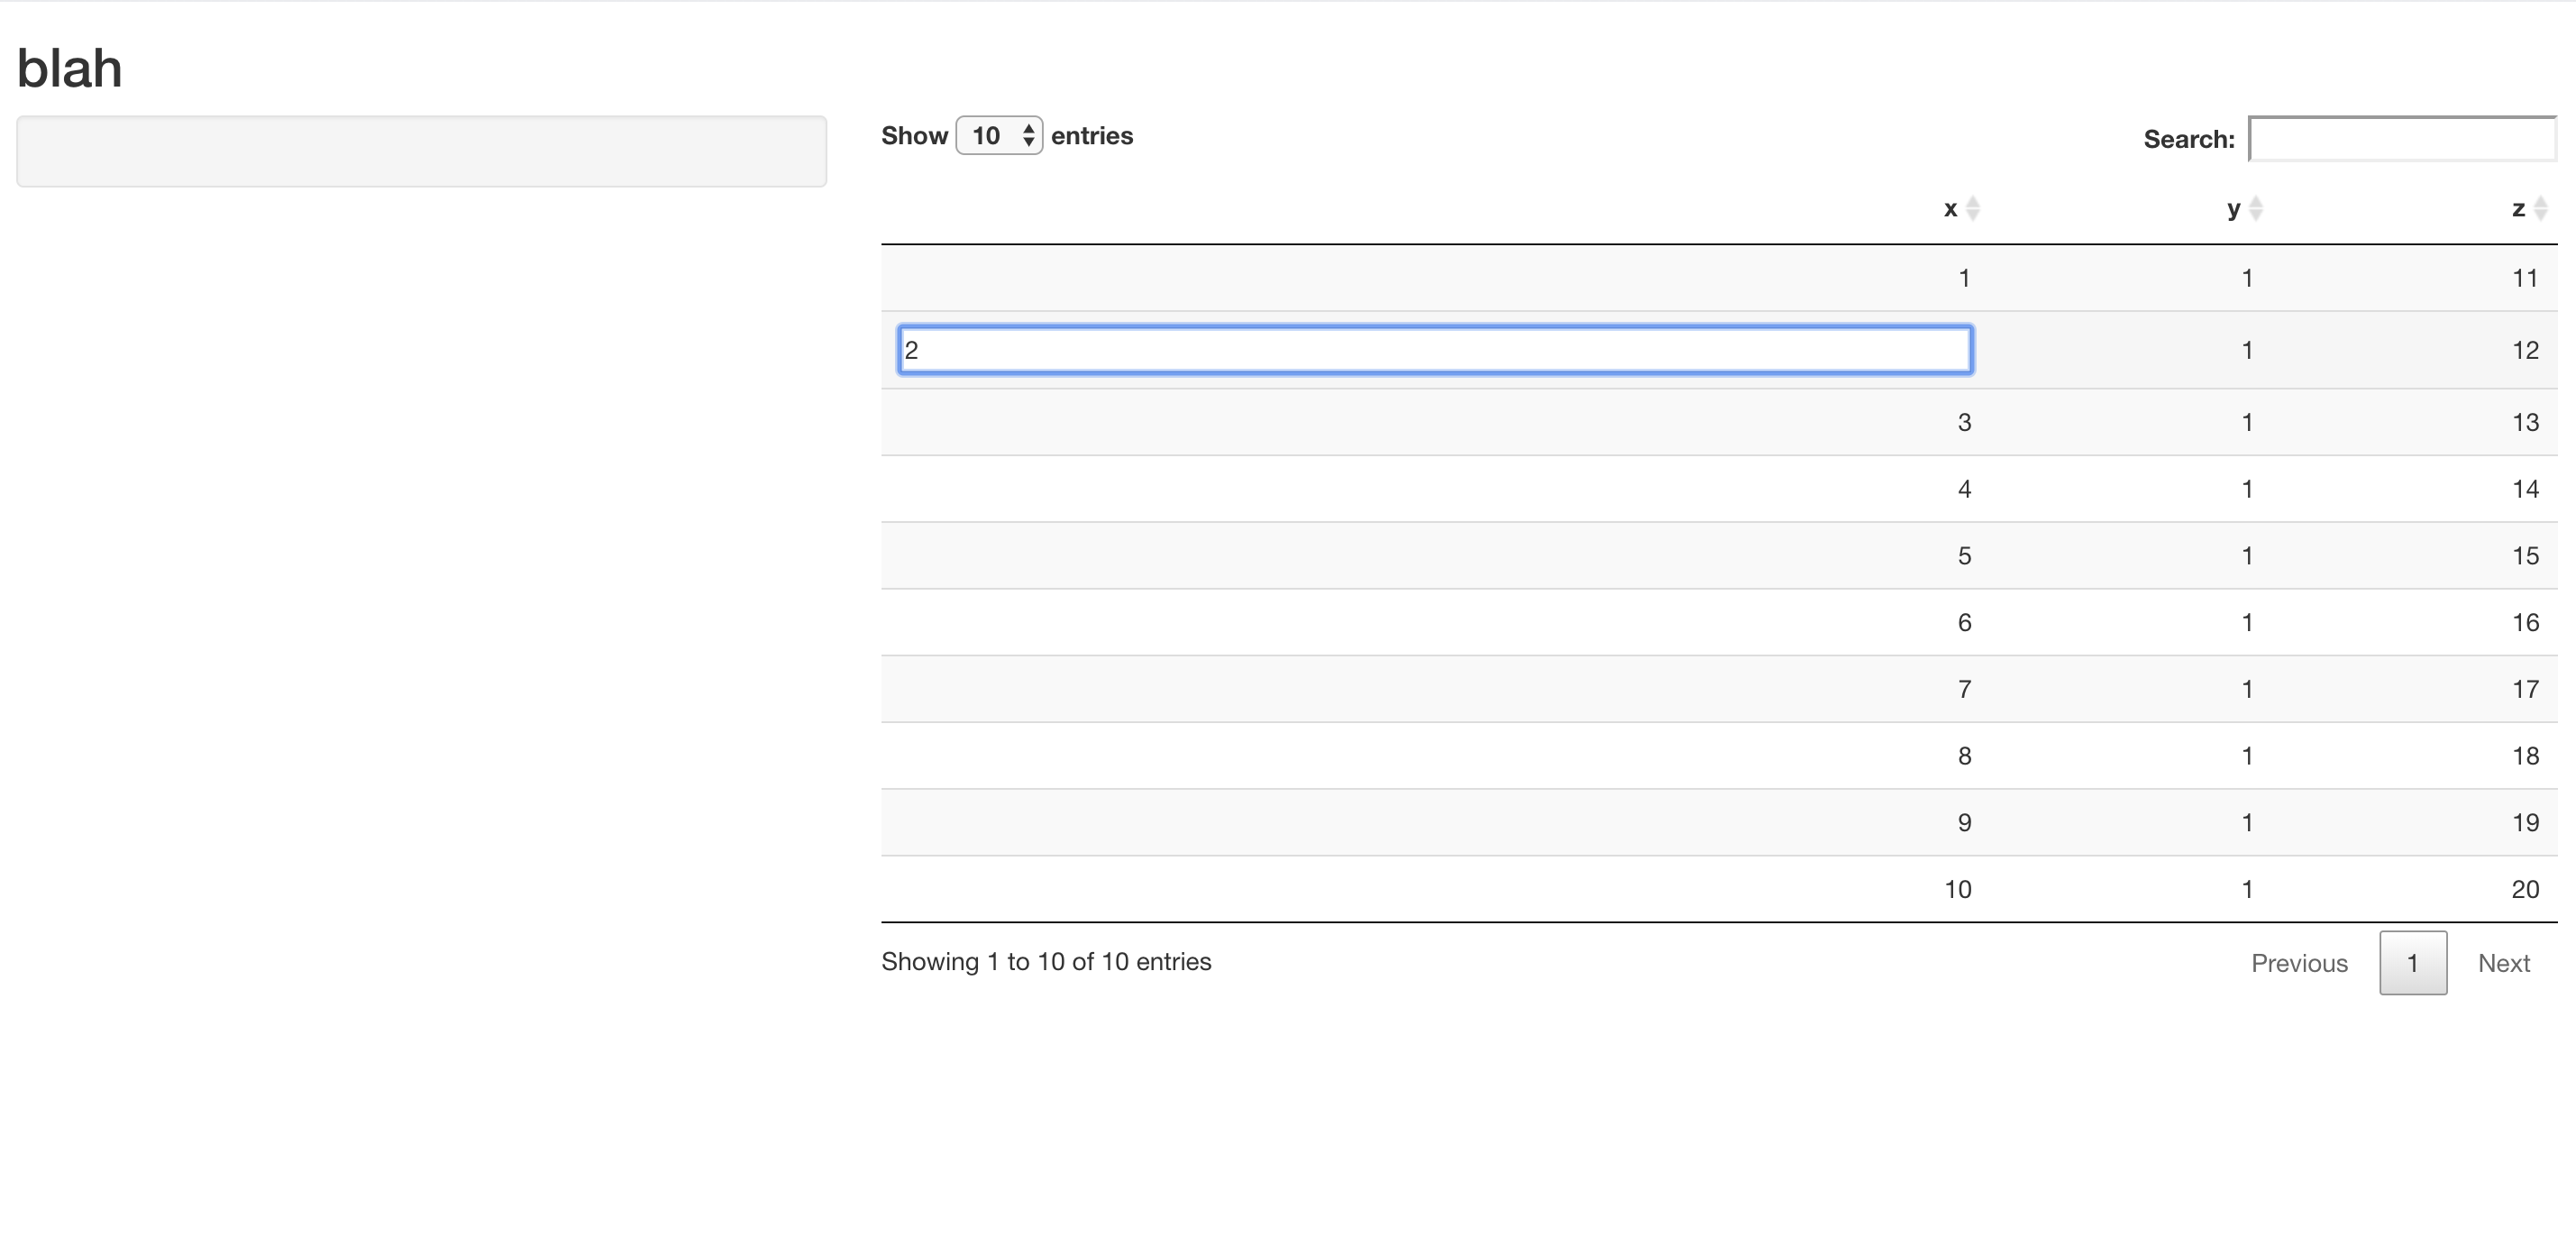
A simple app:
#
# This is a Shiny web application. You can run the application by clicking
# the 'Run App' button above.
#
# Find out more about building applications with Shiny here:
#
#    http://shiny.rstudio.com/
#

library(shiny)

# Define UI for application that draws a histogram
ui <- fluidPage(

    # Application title
    titlePanel("blah"),

    # Sidebar with a slider input for number of bins
    sidebarLayout(
        sidebarPanel(),

        # Show a plot of the generated distribution
        mainPanel(
            DT::DTOutput('ex_df')
        )
    )
)

# Define server logic required to draw a histogram
server <- function(input, output) {

    output$ex_df <- DT::renderDT(data.frame(
        x = 1:10,
        y = 1,
        z = 11:20
    ),

    selection = 'none', editable = 'cell', server = TRUE, rownames = FALSE,
    list(target = 'cell', disable = list(columns = c(1,2)))
    )
}

# Run the application
shinyApp(ui = ui, server = server)
With this line: disable = list(columns = c(1,2) I intended to make the 1st and second column un editable. However, all columns seem to be editable:

How can I set it so that only the 3rd column is editable?
