Remove space between plotted data and the axes
Asked Answered
C

3

177

I have the following dataframe:

uniq <- structure(list(year = c(1986L, 1987L, 1991L, 1992L, 1993L, 1994L, 1995L, 1996L, 1997L, 1998L, 1999L, 2000L, 2001L, 2002L, 2003L, 2004L, 2005L, 2006L, 2007L, 2008L, 2009L, 2010L, 2011L, 2012L, 2013L, 2014L, 1986L, 1987L, 1991L, 1992L, 1993L, 1994L, 1995L, 1996L, 1997L, 1998L, 1999L, 2000L, 2001L, 2002L, 2003L, 2004L, 2005L, 2006L, 2007L, 2008L, 2009L, 2010L, 2011L, 2012L, 2013L, 2014L, 1986L, 1987L, 1991L, 1992L, 1993L, 1994L, 1995L, 1996L, 1997L, 1998L, 1999L, 2000L, 2001L, 2002L, 2003L, 2004L, 2005L, 2006L, 2007L, 2008L, 2009L, 2010L, 2011L, 2012L, 2013L, 2014L), uniq.loc = structure(c(1L, 1L, 1L, 1L, 1L, 1L, 1L, 1L, 1L, 1L, 1L, 1L, 1L, 1L, 1L, 1L, 1L, 1L, 1L, 1L, 1L, 1L, 1L, 1L, 1L, 1L, 2L, 2L, 2L, 2L, 2L, 2L, 2L, 2L, 2L, 2L, 2L, 2L, 2L, 2L, 2L, 2L, 2L, 2L, 2L, 2L, 2L, 2L, 2L, 2L, 2L, 2L, 3L, 3L, 3L, 3L, 3L, 3L, 3L, 3L, 3L, 3L, 3L, 3L, 3L, 3L, 3L, 3L, 3L, 3L, 3L, 3L, 3L, 3L, 3L, 3L, 3L, 3L), .Label = c("u.1", "u.2", "u.3"), class = "factor"), uniq.n = c(1, 1, 1, 2, 5, 4, 2, 16, 16, 10, 15, 14, 8, 12, 20, 11, 17, 30, 17, 21, 22, 19, 34, 44, 56, 11, 0, 0, 3, 3, 7, 17, 12, 21, 18, 10, 12, 9, 7, 11, 25, 14, 11, 17, 12, 24, 59, 17, 36, 50, 59, 12, 0, 0, 0, 1, 4, 6, 3, 3, 9, 3, 4, 2, 5, 2, 12, 6, 8, 8, 3, 2, 9, 5, 20, 7, 10, 8), uniq.p = c(100, 100, 25, 33.3, 31.2, 14.8, 11.8, 40, 37.2, 43.5, 48.4, 56, 40, 48, 35.1, 35.5, 47.2, 54.5, 53.1, 44.7, 24.4, 46.3, 37.8, 43.6, 44.8, 35.5, 0, 0, 75, 50, 43.8, 63, 70.6, 52.5, 41.9, 43.5, 38.7, 36, 35, 44, 43.9, 45.2, 30.6, 30.9, 37.5, 51.1, 65.6, 41.5, 40, 49.5, 47.2, 38.7, 0, 0, 0, 16.7, 25, 22.2, 17.6, 7.5, 20.9, 13, 12.9, 8, 25, 8, 21.1, 19.4, 22.2, 14.5, 9.4, 4.3, 10, 12.2, 22.2, 6.9, 8, 25.8)), .Names = c("year", "uniq.loc", "uniq.n", "uniq.p"), class = "data.frame", row.names = c(NA, -78L))

When I make an area-plot with:

ggplot(data = uniq) + 
  geom_area(aes(x = year, y = uniq.p, fill = uniq.loc), stat = "identity", position = "stack") +
  scale_x_continuous(limits=c(1986,2014)) +
  scale_y_continuous(limits=c(0,101)) +
  theme_bw()

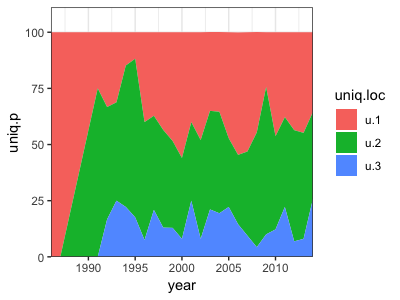
I get this result:

enter image description here

However, I want to remove the space between the axis and the actual plot. When I add theme(panel.grid = element_blank(), panel.margin = unit(-0.8, "lines")) I get the following error message:

Error in theme(panel.grid = element_blank(), panel.margin = unit(-0.8,  : 
  could not find function "unit"

Any suggestions on how to solve this problem?

Crepitate answered 8/4, 2014 at 18:44 Comment(3)
I think you needed to explicitly load the grid package for unitFlanna
@TylerRinker Thanx! I don't get an error message anymore. I solved the problem already in another way, but this is a nice reminder for the future when I want to set margins.Crepitate
This is sometimes referred to as a tight layout. Mentioning this here so that search engines can pick it up.Gibbous
C
271

Update: See @divibisan's answer for further possibilities in the latest versions of .


From ?scale_x_continuous about the expand-argument:

Vector of range expansion constants used to add some padding around the data, to ensure that they are placed some distance away from the axes. The defaults are to expand the scale by 5% on each side for continuous variables, and by 0.6 units on each side for discrete variables.

The problem is thus solved by adding expand = c(0,0) to scale_x_continuous and scale_y_continuous. This also removes the need for adding the panel.margin parameter.

The code:

ggplot(data = uniq) + 
  geom_area(aes(x = year, y = uniq.p, fill = uniq.loc), stat = "identity", position = "stack") +
  scale_x_continuous(limits = c(1986,2014), expand = c(0, 0)) +
  scale_y_continuous(limits = c(0,101), expand = c(0, 0)) +
  theme_bw() +
  theme(panel.grid = element_blank(),
        panel.border = element_blank())

The result: plot area chart with no gaps

Crepitate answered 8/4, 2014 at 18:55 Comment(0)
R
95

As of ggplot2 version 3, there is an expand_scale() function that you can pass to the expand= argument that lets you specify different expand values for each side of the scale.

As of ggplot2 version 3.3.0, expand_scale() has been deprecated in favor of expansion which otherwise functions identically.

It also lets you choose whether you want to the expansion to be an absolute size (use the add= parameter) or a percentage of the size of the plot (use the mult= parameter):

ggplot(data = uniq) + 
  geom_area(aes(x = year, y = uniq.p, fill = uniq.loc), stat = "identity", position = "stack") +
  scale_x_continuous(limits = c(1986,2014), expand = c(0, 0)) +
  scale_y_continuous(limits = c(0,101), expand = expansion(mult = c(0, .1))) +
  theme_bw()

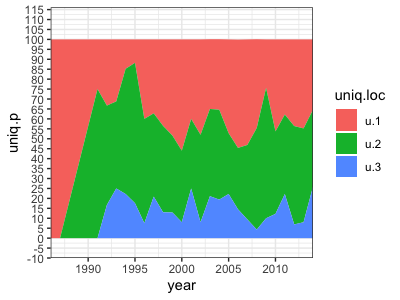
enter image description here


Since this is my top-voted answer, I thought I'd expand this to better illustrate the difference between add= and mult=. Both options expand the plot area a specific amount outside the data. Using add, expands the area by a absolute amount (in the units used for that axis) while mult expands the area by a specified proportion of the total size of that axis.

In the below example, I expand the bottom using add=10, which extends the plot area by 10 units down to -10. I exapand the top using mult=.15 which extends to top of the plot area by 15% of the total size of the data on the y-axis. Since the data goes from 0-100, that is 0.15 * 100 = 15 units – so it extends up to 115.

ggplot(data = uniq) + 
    geom_area(aes(x = year, y = uniq.p, fill = uniq.loc),
              stat = "identity", position = "stack") +
    scale_x_continuous(limits = c(1986,2014), expand = c(0, 0)) +
    scale_y_continuous(limits = c(0,101),
                       breaks = seq(-10, 115, by=15),
                       expand = expansion(mult = c(0, .15),
                                          add = c(10, 0))) +
    theme_bw()

enter image description here

Rhomb answered 13/9, 2018 at 17:25 Comment(2)
Is there any way to remove the expansion from the theme? I would love to be able to have it be absent by default (perhaps it would need to be a custom scale_* function)Contravention
@Contravention Not that I know of. I think your idea is the best: you could define a custom function which is the scale with this default setting. sxc <- function(...) scale_x_continuous(expand = expansion(add=0), ...). Then you can use sxc as you'd use scale_x_continuous, even passing in other arguments, but with that default setting.Rhomb
A
24

Another option producing identical results, is using coord_cartesian instead of continuous position scales (x & y):

ggplot(data = uniq) +  
  geom_area(aes(x = year, y = uniq.p, fill = uniq.loc), stat = "identity", position = "stack") +  
  coord_cartesian(xlim = c(1986,2014), ylim = c(0,101))+
  theme_bw() + theme(panel.grid=element_blank(), panel.border=element_blank())
Abiding answered 30/7, 2015 at 6:59 Comment(3)
Nice alternative, +1. However, you will still need the scales_x/y_continuous parts if you want to specify the breaks ,etc.Crepitate
or, even easier, set expand = FALSE in coord_cartesian as suggested in @Marcus comment in this questionShack
@Tjebo The output is slightly different but in fact it is probably closer to the expected outcome by the OP. I will add it later to my answer. Thank you.Abiding

© 2022 - 2024 — McMap. All rights reserved.