I have the following data set:
In[55]: usdbrl
Out[56]:
        Date   Price    Open    High     Low  Change       STD
0 2016-03-18  3.6128  3.6241  3.6731  3.6051   -0.31  0.069592
1 2016-03-17  3.6241  3.7410  3.7449  3.6020   -3.16  0.069041
2 2016-03-16  3.7422  3.7643  3.8533  3.7302   -0.62  0.068772
3 2016-03-15  3.7656  3.6610  3.7814  3.6528    2.83  0.071474
4 2016-03-14  3.6618  3.5813  3.6631  3.5755    2.23  0.070348
5 2016-03-11  3.5820  3.6204  3.6692  3.5716   -1.09  0.076458
6 2016-03-10  3.6215  3.6835  3.7102  3.6071   -1.72  0.062977
7 2016-03-09  3.6849  3.7543  3.7572  3.6790   -1.88  0.041329
8 2016-03-08  3.7556  3.7826  3.8037  3.7315   -0.72  0.013700
9 2016-03-07  3.7830  3.7573  3.7981  3.7338    0.63  0.000000
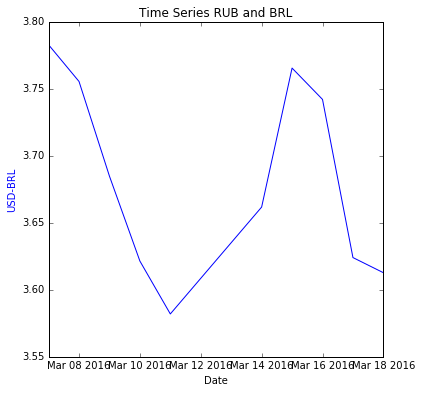
I want to plot Price against Date:
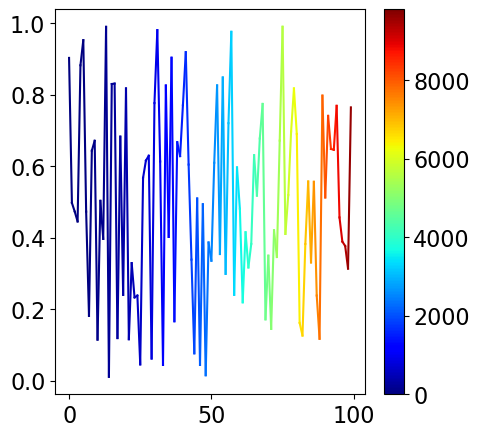
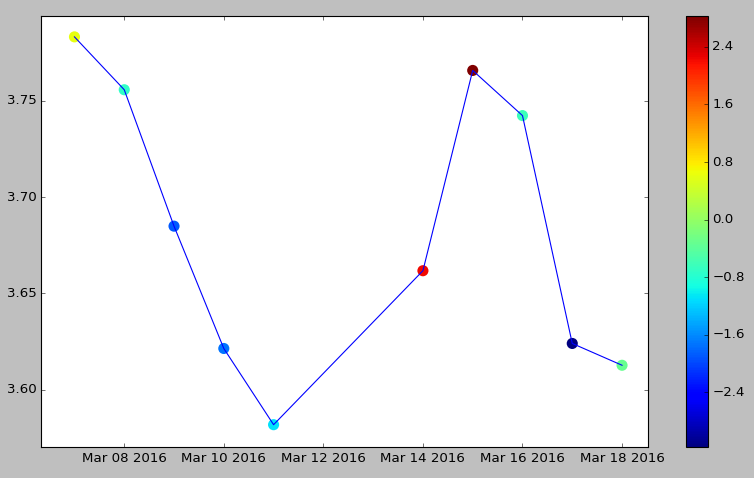
But I would like to color the line by a third variable (in my case Date or Change).
How can I do this please?


