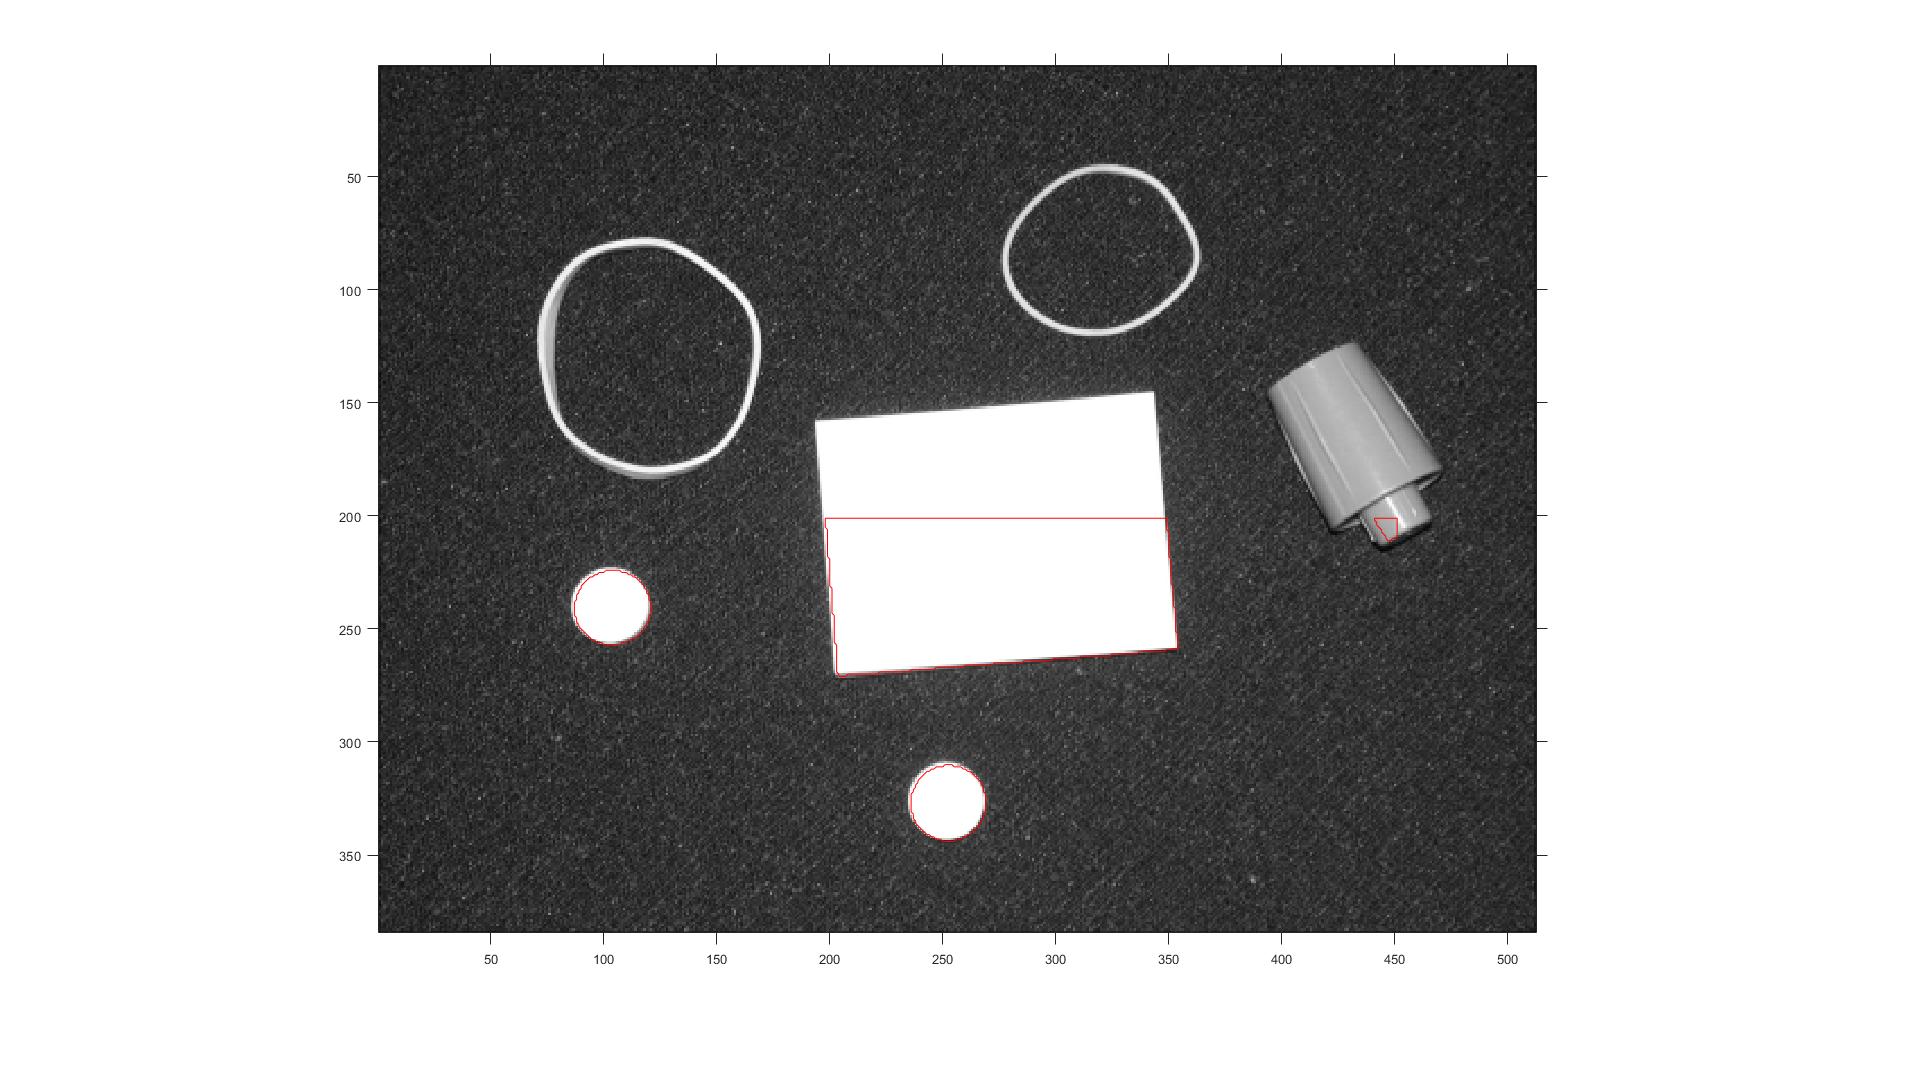
1.- Use MATLAB command bwboundaries
close all;clear all;clc

A=imread('001.jpg');
A2=rgb2gray(A);

BW = imbinarize(A2);

[B,L] = bwboundaries(BW,'noholes');

figure;
imshow(label2rgb(L, @jet, [.5 .5 .5]))
hold on
for k = 1:length(B)
   boundary = B{k};
   plot(boundary(:,2), boundary(:,1), 'w', 'LineWidth', 2)
end
![enter image description here]()
Without the colouring generated with label2rgb
figure;
imshow(L);
hold on
for k = 1:length(B)
   boundary = B{k};
   plot(boundary(:,2), boundary(:,1), 'w', 'LineWidth', 2)
end
![enter image description here]()
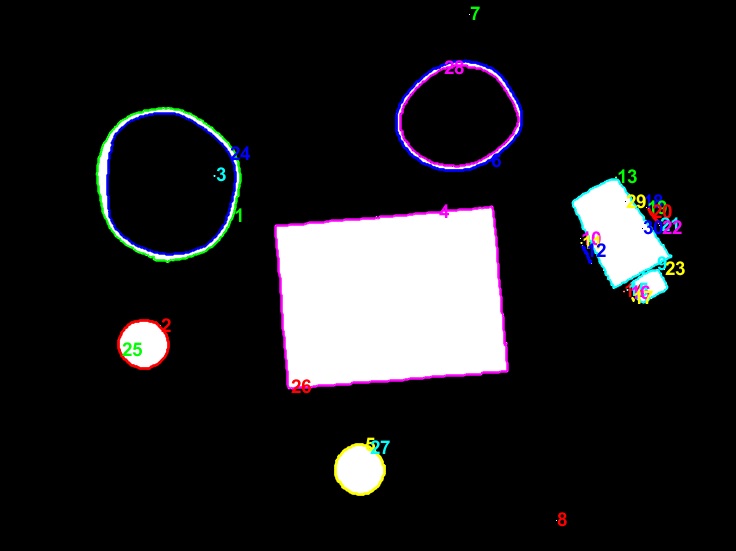
2.- Numbering all found boundaries
[B,L,N,A] = bwboundaries(BW);
figure;
imshow(BW); hold on;
colors=['b' 'g' 'r' 'c' 'm' 'y'];
for k=1:length(B)
  boundary = B{k};
  cidx = mod(k,length(colors))+1;
  plot(boundary(:,2), boundary(:,1),colors(cidx),'LineWidth',2);

  rndRow = ceil(length(boundary)/(mod(rand*k,7)+1));
  col = boundary(rndRow,2); row = boundary(rndRow,1);
  h = text(col+1, row-1, num2str(L(row,col)));
  set(h,'Color',colors(cidx),'FontSize',14,'FontWeight','bold');
end
![enter image description here]()
Too many elements
B
 30×1 cell array
 {446×2 double}
 {146×2 double}
 {  3×2 double}
 {776×2 double}
 {150×2 double}
 {343×2 double}
 {  2×2 double}
 {  2×2 double}
 {408×2 double}
  ...
 {  2×2 double}
 {543×2 double}
 {  2×2 double}
 {  2×2 double}
 {  2×2 double}
 {441×2 double}
 {  2×2 double}
 {  2×2 double}


size(B)
 =
 30     1
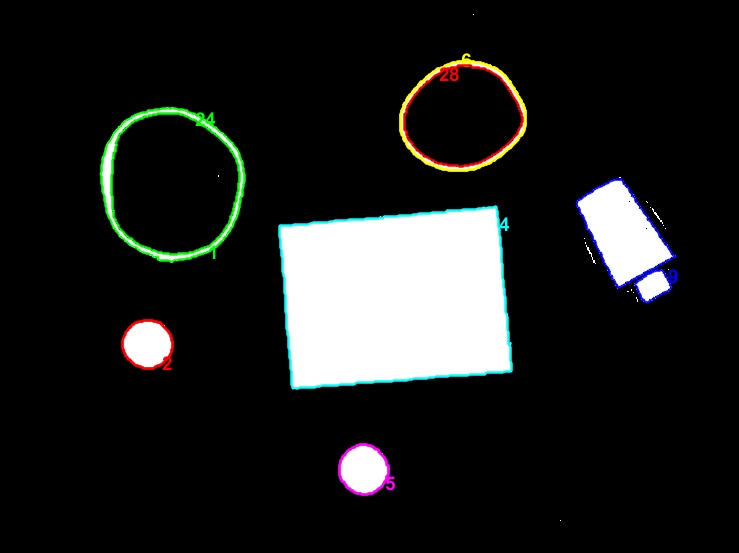
3.- Removing small elements
th1=100;   % threshold
B2={}
for k=1:1:size(B,1)
    B0=B{k};
    if size(B0,1)>th1
        B2=[B2 B0];
    end
end

figure;
imshow(BW); hold on;
colors=['b' 'g' 'r' 'c' 'm' 'y'];
for k=1:length(B2)
  boundary = B2{k};
  cidx = mod(k,length(colors))+1;
  plot(boundary(:,2), boundary(:,1),colors(cidx),'LineWidth',2);

  rndRow = ceil(length(boundary)/(mod(rand*k,7)+1));
  col = boundary(rndRow,2); row = boundary(rndRow,1);
  h = text(col+1, row-1, num2str(L(row,col)));
  set(h,'Color',colors(cidx),'FontSize',14,'FontWeight','bold');
end
![enter image description here]()
4.- Other interesting commands:
imfill : fill holes. Specific locations can be fed.
imdilate : Dilating thin lines may also be useful
imclearborder : file rough edges


pillsetc.png, so I can work on it. – Pile