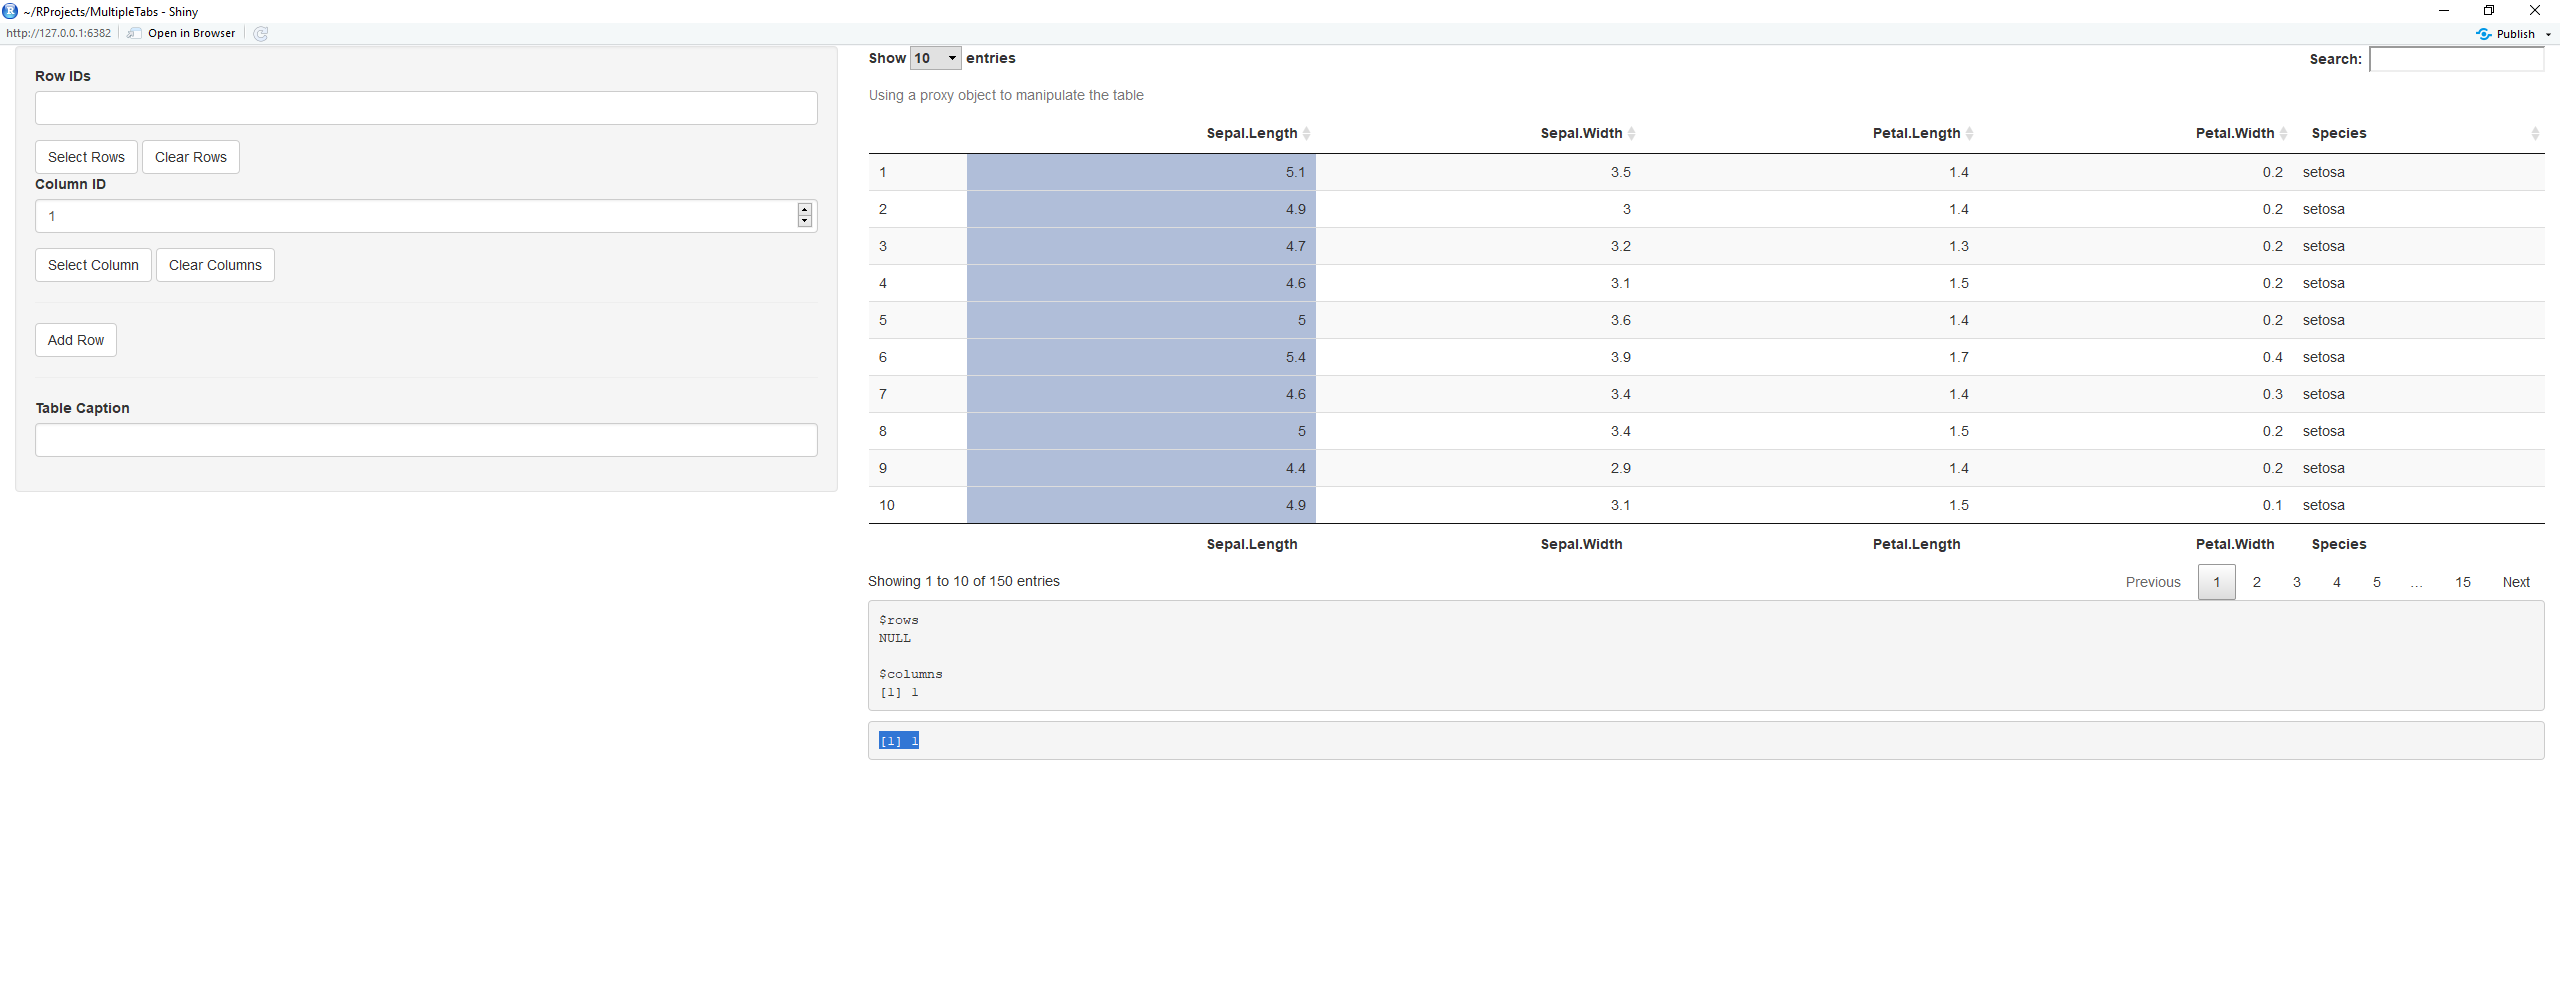
I have been working on trying to grasp how to make DT::dataTableProxy Using DT in Shiny work within my app, but I cannot get passed returning the selected columns.
Following the example here, I attempted to modify the code to print descriptive statistics (using pastecs). But the only thing that renders is the literal column selected.
#modified UI, adding another verbatimTextOutput

ui =
...
verbatimTextOutput('foo2')

server =
...
  output$foo2= renderPrint({
    x<-input$foo_columns_selected
    stat.desc(x)
  })
What I would like to do, is obtain the values of the selected column, and run the function
stat.desc. In the above example, it would be ran on column 2 (Sepal.Width), and render the descriptive statistics. Like this:
Going forward, I would like to have stat.desc performed on a rendered DataTable from multiple selectInputs. But..one step at a time. I want to grasp first how to get the actual values to perform functions on.
Update!
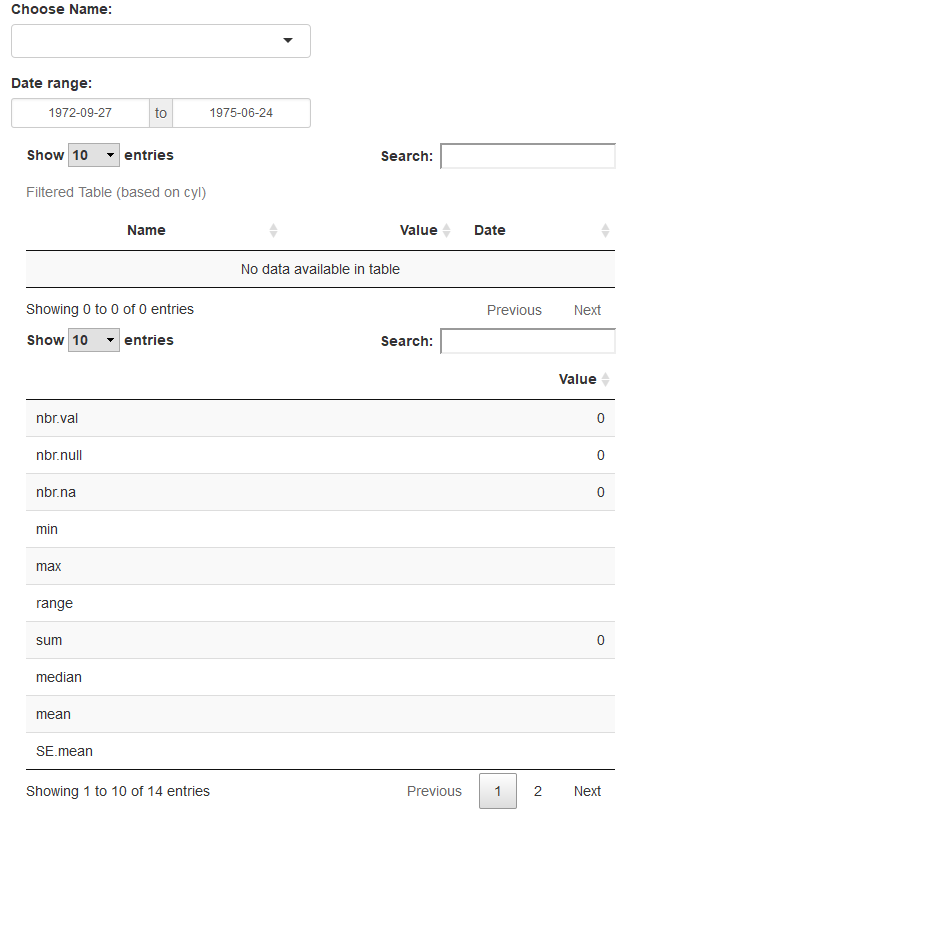
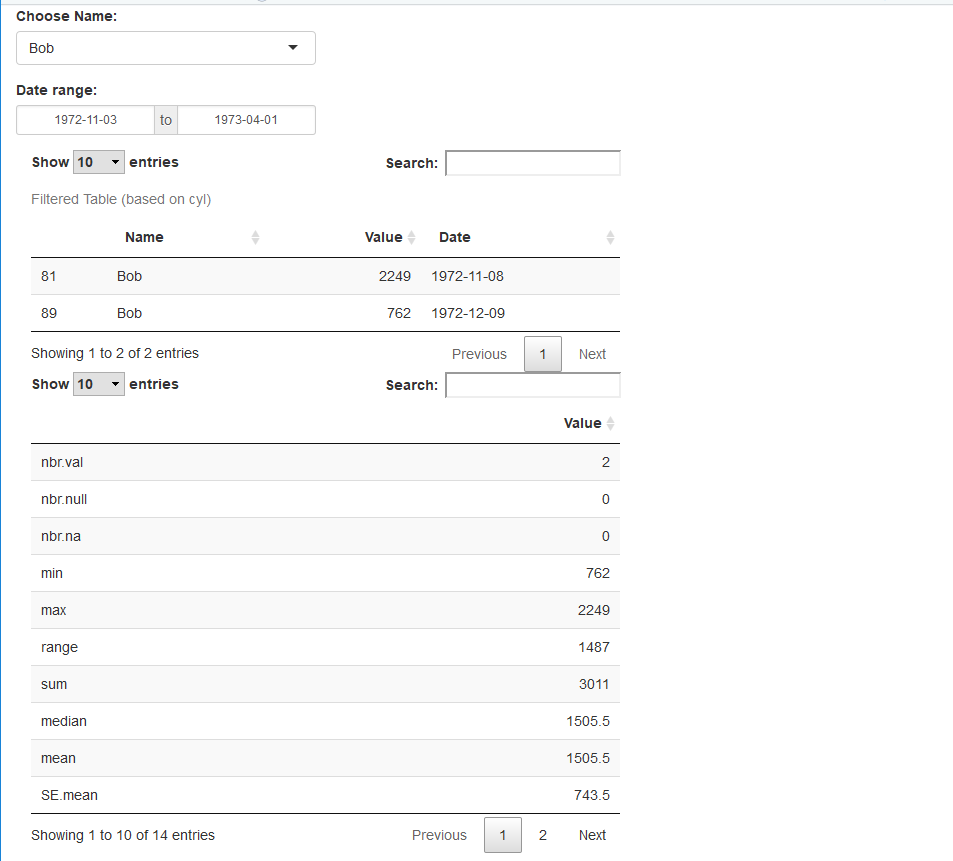
So, I think i figured out how to successfully accomplish what I needed. Would love if a fellow user could validate that it is working properly:
Updated script:
require(DT)
library(dplyr)
library(tibble)

ui<-
  fluidPage(

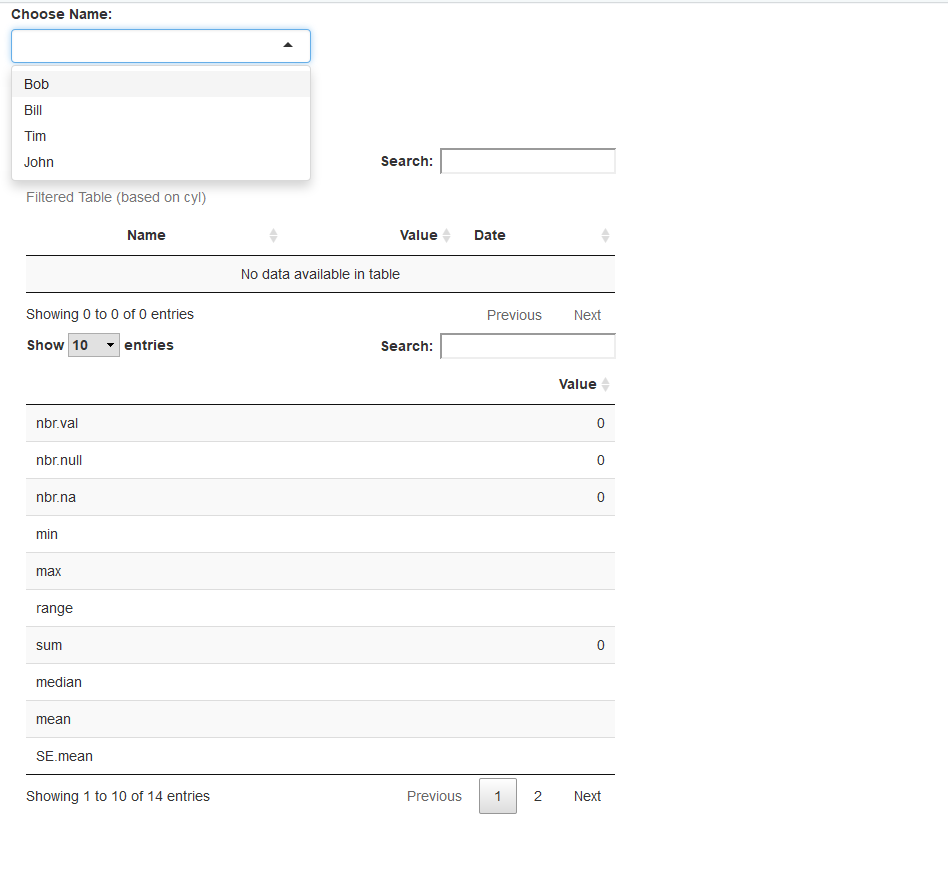
    selectInput('obj','Choose Name:', choices = c('',my.data$Name), selectize = TRUE),
    dateRangeInput('daterange',"Date range:",
                   start= min(my.data$Date),
                   end = max(my.data$Date)),

    mainPanel(
      dataTableOutput('filteredTable'),
      dataTableOutput('filteredTable2'),
      tableOutput('table')
    )
)

server<-function(input,output, session){


  filteredTable_data <- reactive({

    my.data %>% rownames_to_column() %>%  ##dplyr's awkward way to preserve rownames

      filter(., Name == input$obj) %>%
      filter(., between(Date ,input$daterange[1], input$daterange[2])) %>%
      column_to_rownames()

    })

##explicit assignment to output ID

  DT::dataTableOutput("filteredTable")

  output$filteredTable <- DT::renderDataTable({

    datatable(

      filteredTable_data(),

      selection = list(mode = "multiple"),

      caption = "Filtered Table (based on cyl)"

       )

    })

  filteredTable_selected <- reactive({
    ids <- input$filteredTable_rows_all
    filteredTable_data()[sort(ids),]  ##sort index to ensure orig df sorting
  })

  ##anonymous
  output$filteredTable2<-DT::renderDataTable({

    x<-filteredTable_selected() %>% select(starts_with("Value"))

    x<-as.data.frame(stat.desc(x))

    datatable(
      x)

  })

}

shinyApp(ui, server)
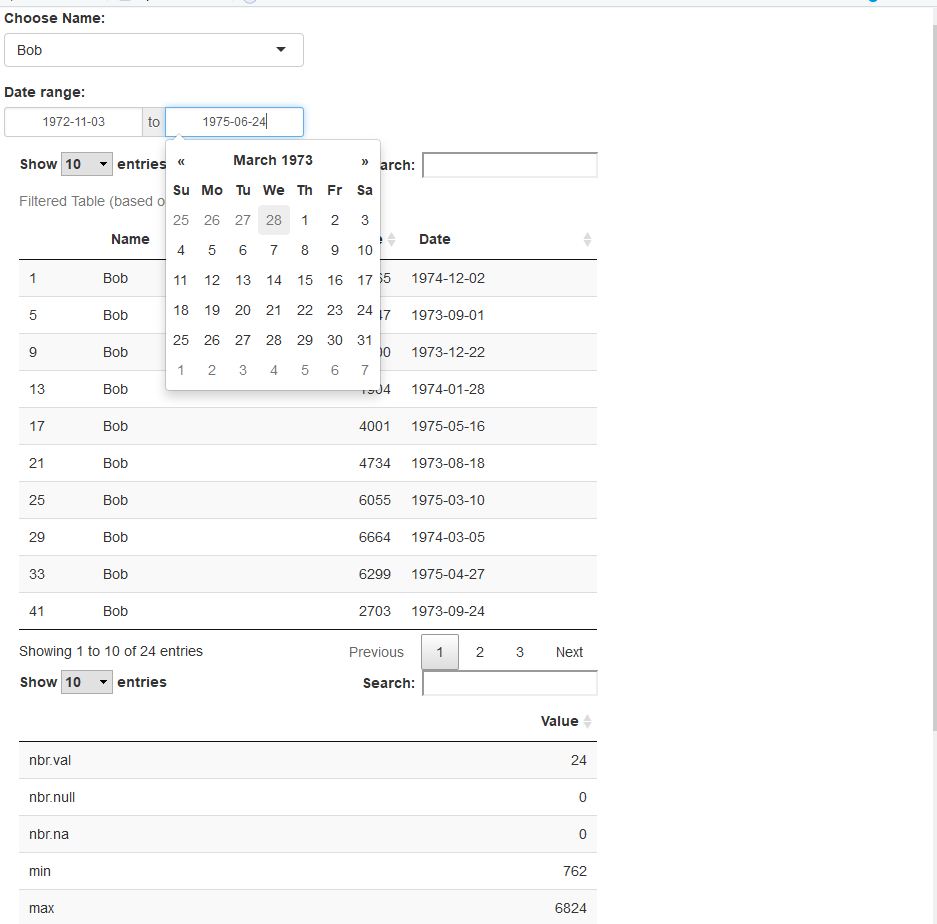
Result:
The following answers helped immensely: Reading objects from shiny output object not allowed? & How do I get the data from the selected rows of a filtered datatable (DT)?

