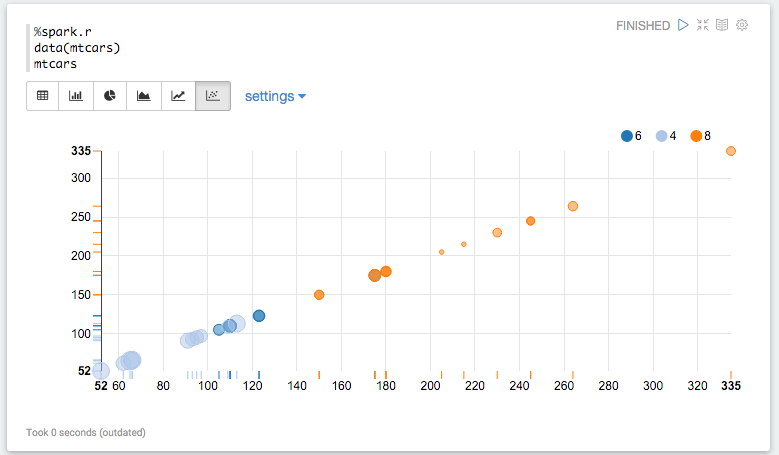
The zeppelin R interpreter documentation states:
If you return a data.frame, Zeppelin will attempt to display it using Zeppelin's built-in visualizations.
This can be seen in the documentation example:
However, when I attempt to run the same R commands from my zeppelin 0.6.0 notebook, I see the following:
Any idea why I'm not seeing the tabular output?


registerTempTable(dataframe, "temp_table")and use sql interpreter to display%sql select * from temp_table– Ellersickz.show(varname)in order to map the dataframe from the interpreter to this inbuilt plot function. Al least that's the way to do within the python interpreter: zeppelin.apache.org/docs/0.6.2/interpreter/python.html – Haematoblast