Mayavi how to show the axes grid
Asked Answered
S

1

8

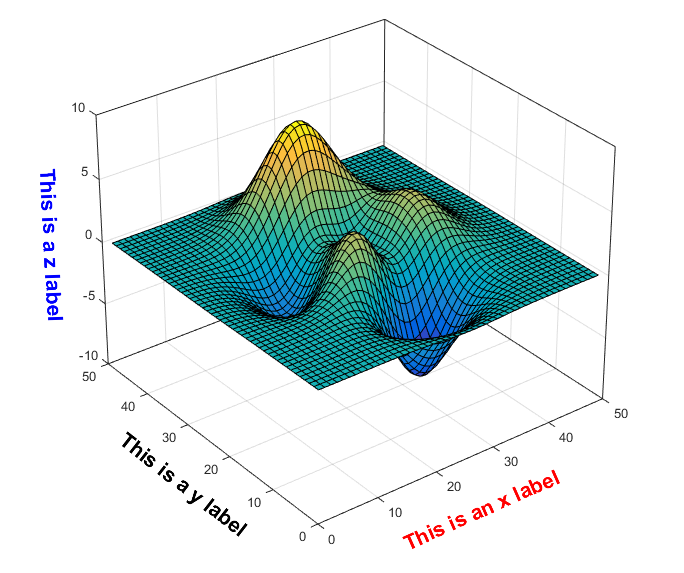
In Mayavi I would like to see the grid of the axes in the following plot

# Source: <<https://scicomp.stackexchange.com/a/23148/10048>>.
import numpy as np
from mayavi import mlab

# Test data: Matlab `peaks()`
x, y = np.mgrid[-3:3:50j, -3:3:50j]
z = 3*(1 - x)**2 * np.exp(-x**2 - (y + 1)**2) \
   - 10*(x/5 - x**3 - y**5)*np.exp(-x**2 - y**2) \
   - 1./3*np.exp(-(x + 1)**2 - y**2) 

mlab.figure(bgcolor=(1, 1, 1))  # Make background white.
surf = mlab.surf(x, y, z, colormap='RdYlBu', warp_scale=0.3, representation='wireframe', line_width=0.5)
mlab.outline(color=(0, 0, 0))
axes = mlab.axes(color=(0, 0, 0), nb_labels=5)
axes.title_text_property.color = (0.0, 0.0, 0.0)
axes.title_text_property.font_family = 'times'
axes.label_text_property.color = (0.0, 0.0, 0.0)
axes.label_text_property.font_family = 'times'
# mlab.savefig("vector_plot_in_3d.pdf")
mlab.gcf().scene.parallel_projection = True  # Source: <<https://mcmap.net/q/1473524/-how-to-set-parallel-perspective-on-a-3d-plot>>.
mlab.orientation_axes()  # Source: <<https://mcmap.net/q/1473525/-mayavi-python-axes-indicator>>.
mlab.show()

like in Matlab

The axes grid is shown as I want here

Which command do I have to employ in Mayavi to achieve this?

Soilasoilage answered 25/2, 2019 at 9:57 Comment(6)
did you manage to create such axis? If yes, how?Contrecoup
@TiagosupportsGoFundMonica It's been a while, but as far as I can remember I gave up because Mayavi keeps 'complaining' with errors for even the simplest tasks, like showing a grid.Soilasoilage
thank you. The axis is easy to show but the grid... Their focus is more about showing as many points as possibleContrecoup
did you use something else instead @Soilasoilage ?Contrecoup
@TiagosupportsGoFundMonica I'm still 'stuck' with Matplotlib which has many capabilities, also for 3d, and is easy to work with, but it is unfortunately EXTREMELY SLOW. This is well known disadvantage of Matplotlib. I didn't find an alternative yet.Soilasoilage
I've seen examples of 3D bar charts built with Matplotlib and they were soo imperfect rendering. Then, found out in their FAQs they also suggest Mayavi. Know of some others due to this answer.Contrecoup
H
1

My suggestion would be to use a user defined filter like CubeAxesActor from VTK (which seems more complete than the Axes filter in default Mayavi). Which in Mayavi would translate into something like

...
from mayavi import mlab
from tvtk.api import tvtk

...
# Load data
...
mlab.pipeline.user_defined(data, filter=tvtk.CubeAxesActor())
...

But it seems Mayavi does not like this filter

traits.trait_errors.TraitError: Cannot set the undefined 'input_connection' attribute of a 'CubeAxesActor' object.

I'm not sure if it is related to my VTK version but you might try

Herefordshire answered 25/2, 2019 at 14:43 Comment(5)
How would you employ this 'filter' in my code example to get the grid to show for all the three axes?Soilasoilage
After surf=... you can add mlab.pipeline.user_defined(surf, filter=tvtk.CubeAxesActor())Herefordshire
I add the lines import tvtk and mlab.pipeline.user_defined(surf, filter=tvtk.CubeAxesActor()) to the code after the surf command, but unfortunately get the error AttributeError: module 'tvtk' has no attribute 'CubeAxesActor'.Soilasoilage
You have to import tvtk as from tvtk.api import tvtkHerefordshire
I unfortunately get the error File "...\lib\site-packages\mayavi\filters\filter_base.py", line 73, in update_pipeline fil.update() AttributeError: 'CubeAxesActor' object has no attribute 'update'Soilasoilage

© 2022 - 2024 — McMap. All rights reserved.