Ciao all,
I am working with plotly.
I need to draw a curve and fill the area under it. It could be some NaNs appear and it is very important that in that case area is not filled.
Please notice that in my case 0 and NaN are different so that setting NaN to 0 is a solution for the area issue that does not fit in my case.
I tried with the following code:
import plotly.graph_objs as go
from plotly.offline import plot

p = go.Scatter(x=range(0,12),
           y = [1,2,3,np.nan, np.nan, np.nan, np.nan, np.nan, 0,0,0,5],
           fill='tozeroy')
fig = go.Figure([p])
plot(fig, auto_open=True)
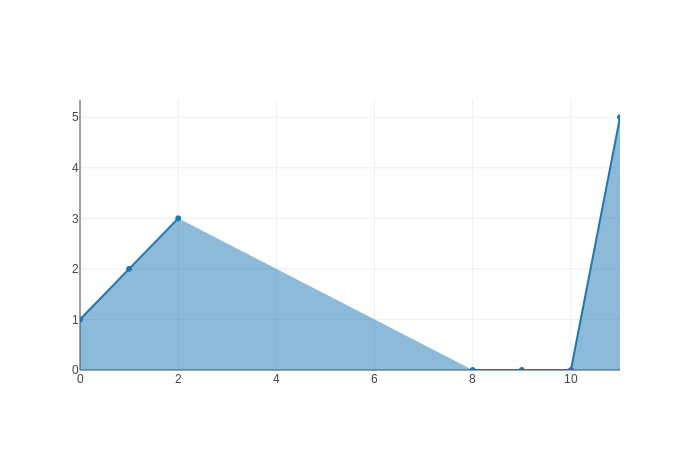
but I get a result I do not like. As you can see there are no points corresponding to the NaN, so that nothing will be displays in the hovermode (I like it!) but there is the area.
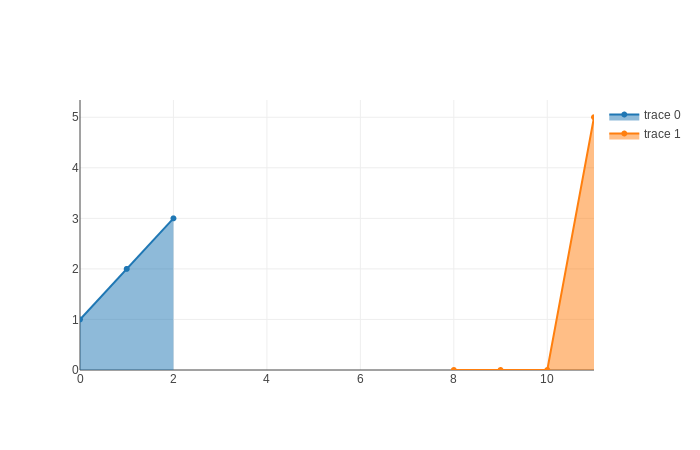
I'd like to reach this result:
import plotly.graph_objs as go
from plotly.offline import plot

p1 = go.Scatter(x=range(0,3),
           y = [1,2,3],
           fill='tozeroy')
p2 = go.Scatter(x=range(8,12),
           y = [0,0,0,5],
           fill='tozeroy')

fig = go.Figure([p1, p2])
plot(fig, auto_open=True)
(Of course I'd like the plot to have only one color and only one element in the legend.)
Can you help me to reproduce the second plot without splitting the curve in multiple curves?
Thanks
am


