How to show additional data in tooltip at each point on time series graph in Grafana
Asked Answered
R

1

8

I need some help with tooltips on time series graph in Grafana. I am executing a kusto query which projects these 3 values: date_time (timestamp), data (int), and build_id (string).

Using this query, I am creating a time series graph. By default when i hover over any data point on the graph, i can only see data value as tool-tip. I also want to show build_id along with data on hover. In future, I might need to include more information in this tool tips information.

any workaround to get this working in grafana for now?

Revival answered 4/7, 2023 at 20:59 Comment(1)
AFAIK not possible with a time series graph. Possible with bar chart if that is an option.Variola
V
1

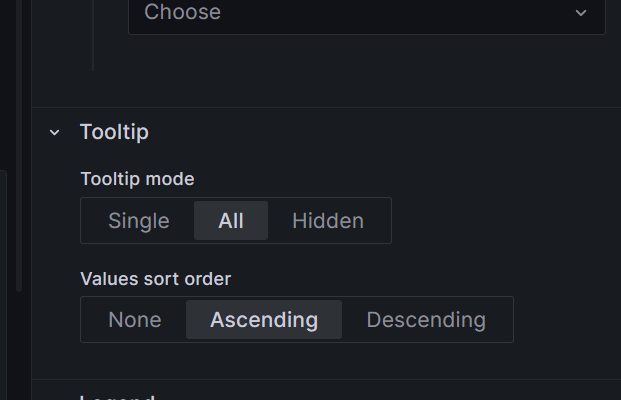
If you are using timeseries visualization you have the option to configure tooltip:

enter image description here

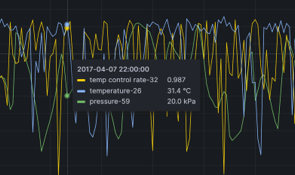
When you change from single to all you will see multiple values in the tooltip.

enter image description here

Virginity answered 7/7, 2023 at 7:55 Comment(1)
You have show three lines and three data in tooltip. I want to add more information and data from each line. Like maybe in total 3 data informations from each line.Revival

© 2022 - 2024 — McMap. All rights reserved.