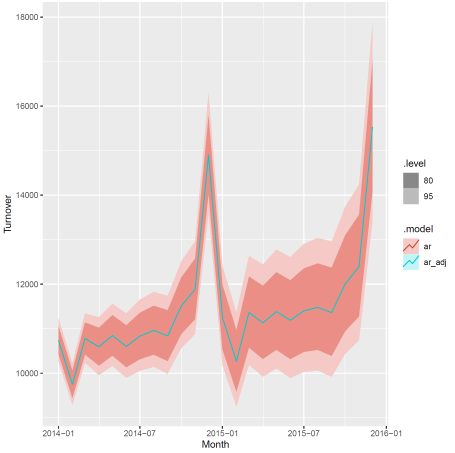
I'm trying to do hierarchical forecasting after the fashion of Rob Hyndman's Rstudio.conf workshop, and running into some problems. Here is my code:
library(dplyr)
library(tsibbledata)
library(tsibble)
library(fable)

aus_retail_2013_tr <- aus_retail %>%
    filter(Month <= yearmonth("2013 Dec"))
aus_retail_2013_vl <- aus_retail %>%
    filter(Month > yearmonth("2013 Dec"))

hmod <- aus_retail_2013_tr %>%
    aggregate_key(State*Industry, Turnover=sum(Turnover)) %>%
    model(ar=ARIMA(log(Turnover))) %>%
    reconcile(ar_adj=min_trace(ar))

fcasts_hmod <- forecast(hmod, aus_retail_2013_vl)

fcasts_hmod %>%
    filter(is_aggregated(Industry), State == "Victoria") %>%
    autoplot()
The output of the plot is below.
My main problems are:
- The reconciliation doesn't actually seem to have changed the forecasts at all. The picture indicates that the
arandar_adjlines are identical. - The forecast is only for the time period 2014 to 2015, whereas I know that the full dataset goes to 2018.
How can I fix these? The latter one is probably because not all the time series cover the entire period, but how can I get reconcile to not skip over missing periods?
This is with dplyr 0.8.5, fable 0.2.0, fabletools 0.1.3 and tsibble 0.8.6. I get the same results on both Ubuntu/R 3.6.3 and Windows 10/R 4.0.0.
PS. Trying to forecast for a fixed horizon results in an error:
> fcasts_hmod <- forecast(hmod, h="5 years")
Error: Reconciliation of non-normal forecasts is not yet supported.
Run `rlang::last_error()` to see where the error occurred.


forecastcall:Reconciliation of temporal hierarchies is not yet supported.– Gravitativehtspackage? – Ignitron