You can use bootstrap to approximate every quantity also coming from unknown distributions
def bootstrap_ci(
    data,
    statfunction=np.average,
    alpha = 0.05,
    n_samples = 100):

    """inspired by https://github.com/cgevans/scikits-bootstrap"""
    import warnings

    def bootstrap_ids(data, n_samples=100):
        for _ in range(n_samples):
            yield np.random.randint(data.shape[0], size=(data.shape[0],))

    alphas = np.array([alpha/2, 1 - alpha/2])
    nvals = np.round((n_samples - 1) * alphas).astype(int)
    if np.any(nvals < 10) or np.any(nvals >= n_samples-10):
        warnings.warn("Some values used extremal samples; results are probably unstable. "
                      "Try to increase n_samples")

    data = np.array(data)
    if np.prod(data.shape) != max(data.shape):
        raise ValueError("Data must be 1D")
    data = data.ravel()

    boot_indexes = bootstrap_ids(data, n_samples)
    stat = np.asarray([statfunction(data[_ids]) for _ids in boot_indexes])
    stat.sort(axis=0)

    return stat[nvals]
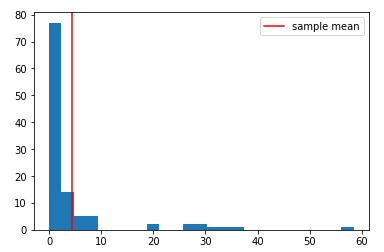
Simulate some data from a pareto distribution:
np.random.seed(33)
data = np.random.pareto(a=1, size=111)
sample_mean = np.mean(data)

plt.hist(data, bins=25)
plt.axvline(sample_mean, c='red', label='sample mean'); plt.legend()
![enter image description here]()
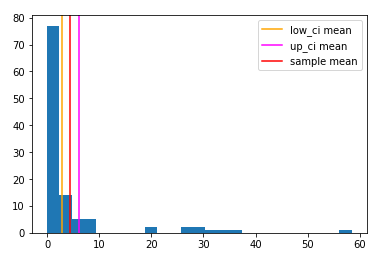
Generate confidence intervals for the SAMPLE MEAN with bootstrapping:
low_ci, up_ci = bootstrap_ci(data, np.mean, n_samples=1000)
plot the resuts
plt.hist(data, bins=25)
plt.axvline(low_ci, c='orange', label='low_ci mean')
plt.axvline(up_ci, c='magenta', label='up_ci mean')
plt.axvline(sample_mean, c='red', label='sample mean'); plt.legend()
![enter image description here]()
Generate confidence intervals for the DISTRIBUTION PARAMETERS with bootstrapping:
from scipy.stats import pareto

true_params = pareto.fit(data)
low_ci, up_ci = bootstrap_ci(data, pareto.fit, n_samples=1000)
low_ci[0] and up_ci[0] are the confidence intervals for the shape param
low_ci[0], true_params[0], up_ci[0] ---> (0.8786, 1.0983, 1.4599)
 But I don't know for sure.

