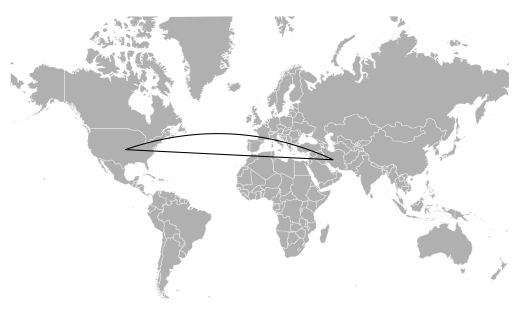
I think what you're looking for are 'Bezier' curves (check wikipedia for a thorough explanation on the topic https://en.wikipedia.org/wiki/Bézier_curve). In R, this is implemented using a number of different packages or you can create your own like the following:
 #Load dependencies
library(ggplot2)
library(maptools)
library(geosphere)

#Identify countries of interest and their centroids (see https://www.cia.gov/library/publications/the-world-factbook/fields/2011.html)
countries <- data.frame(
  Country=c("United States", "Iran"),
  ISO3=c("USA","IRN"),
  latitude=c(38,32),
  longitude=c(-97,53),
  stringsAsFactors=FALSE)

#Get world map
data(wrld_simpl)
map.data <- fortify(wrld_simpl)

#Set up map
draw.map <- function(ylim=c(0,85)) {
  ggplot(map.data, aes(x=long, y=lat, group=group)) +
    geom_polygon(fill="grey") +
    geom_path(size=0.1,color="white") +
    coord_map("mercator", ylim=c(-60,120), xlim=c(-180,180)) +
    theme(line = element_blank(),
          text = element_blank())
}

#Identify the points of the curve
p1 <- c(countries$longitude[1],
        countries$latitude[1])
p2 <- c(countries$longitude[2],
        countries$latitude[2])

#Create function to draw Brezier curve
bezier.curve <- function(p1, p2, p3) {
  n <- seq(0,1,length.out=50)
  bx <- (1-n)^2 * p1[[1]] +
    (1-n) * n * 2 * p3[[1]] +
    n^2 * p2[[1]]
  by <- (1-n)^2 * p1[[2]] +
    (1-n) * n * 2 * p3[[2]] +
    n^2 * p2[[2]]
  data.frame(lon=bx, lat=by)
}

bezier.arc <- function(p1, p2) {
  intercept.long <- (p1[[1]] + p2[[1]]) / 2
  intercept.lat  <- 85
  p3 <- c(intercept.long, intercept.lat)
  bezier.curve(p1, p2, p3)
}

arc3 <- bezier.arc(p1,p2)

bezier.uv.arc <- function(p1, p2) {
  # Get unit vector from P1 to P2
  u <- p2 - p1
  u <- u / sqrt(sum(u*u))
  d <- sqrt(sum((p1-p2)^2))
  # Calculate third point for spline
  m <- d / 2
  h <- floor(d * .2)
  # Create new points in rotated space
  pp1 <- c(0,0)
  pp2 <- c(d,0)
  pp3 <- c(m, h)
  mx <- as.matrix(bezier.curve(pp1, pp2, pp3))
  # Now translate back to original coordinate space
  theta <- acos(sum(u * c(1,0))) * sign(u[2])
  ct <- cos(theta)
  st <- sin(theta)
  tr <- matrix(c(ct,  -1 * st, st, ct),ncol=2)
  tt <- matrix(rep(p1,nrow(mx)),ncol=2,byrow=TRUE)
  points <- tt + (mx %*% tr)
  tmp.df <- data.frame(points)
  colnames(tmp.df) <- c("lon","lat")
  tmp.df
}

arc4 <- bezier.uv.arc(p1,p2)

bezier.uv.merc.arc <- function(p1, p2) {
  pp1 <- p1
  pp2 <- p2
  pp1[2] <- asinh(tan(p1[2]/180 * pi))/pi * 180
  pp2[2] <- asinh(tan(p2[2]/180 * pi))/pi * 180

  arc <- bezier.uv.arc(pp1,pp2)
  arc$lat <-  atan(sinh(arc$lat/180 * pi))/pi * 180
  arc
}


arc5 <- bezier.uv.merc.arc(p1, p2)
d <- data.frame(lat=c(32,38),
                lon=c(53,-97))
draw.map() +
  geom_path(data=as.data.frame(arc5),
            aes(x=lon, y=lat, group=NULL)) +
  geom_line(data=d, aes(x=lon, y=lat, group=NULL),
            color="black", size=0.5)
![enter image description here]()
Also see http://dsgeek.com/2013/06/08/DrawingArcsonMaps.html for a more thorough explanation of Bezier curves using ggplot2

