Confusion matrix for Clustering in scikit-learn
Asked Answered
E

2

8

I have a set of data with known labels. I want to try clustering and see if I can get the same clusters given by known labels. To measure the accuracy, I need to get something like a confusion matrix.

I know I can get a confusion matrix easily for a test set of a classification problem. I already tried that like this.

However, it can't be used for clustering as it expected both columns and rows to have the same set of labels, which makes sense for a classification problem. But for a clustering problem what I expect is something like this.

Rows - Actual labels

Columns - New cluster names (i.e. cluster-1, cluster-2 etc.)

Is there a way to do this?

Edit: Here are more details.

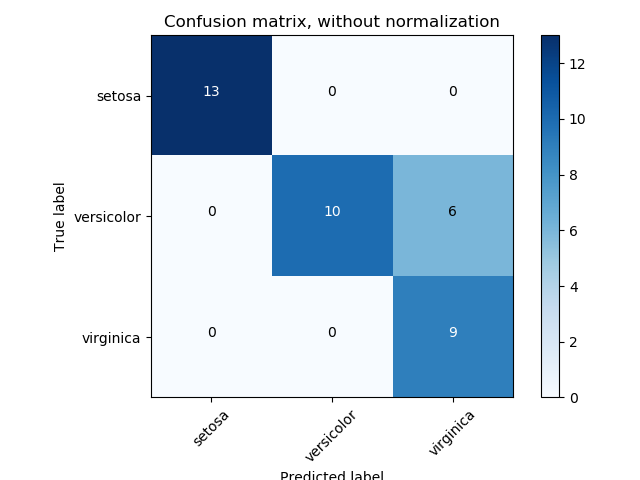
In sklearn.metrics.confusion_matrix, it expects y_test and y_pred to have the same values, and labels to be the labels of those values.

That's why it gives a matrix which has the same labels for both rows and columns like this.

enter image description here

But in my case (KMeans Clustering), the real values are Strings and estimated values are numbers (i.e. cluster number)

Therefore, if I call confusion_matrix(y_true, y_pred) it gives below error.

ValueError: Mix of label input types (string and number)

This is the real problem. For a classification problem, this makes sense. But for a clustering problem, this restriction shouldn't be there, because real label names and new cluster names don't need to be the same.

With this, I understand I'm trying to use a tool, which is supposed to be used for classification problems, for a clustering problem. So, my question is, is there a way I can get such a matrix for may clustered data.

Hope the question is now clearer. Please let me know if it isn't.

Evensong answered 8/12, 2017 at 6:25 Comment(6)
Please clarify this with an example sampleBlockhead
Added more details. Thanks.Evensong
So unless you know how to map a cluster number to your real results, how will you proceed?Blockhead
That mapping part is exactly what I'm trying to learn. I just want to know if the real labels and natural cluster numbers can be mapped or not. I can do it myself if I can get real labels in columns and cluster names in rows (or the vice-versa). If I get the Iris dataset for an example, basically what I want to know is, how many setosas, how many virginica etc in each of my new clusters. Do you understand what I'm looking for?Evensong
Check the chapter on clustering performance evaluation in scikit-learn documentation (e.g., Adjusted Rand index, Normalized/Adjusted Mutual Information, V-measure).Cosmos
Thanks, I'm already doing that. I just want to see how my original labels are distributed among new clusters.Evensong
E
2

I wrote a code myself.

# Compute confusion matrix
def confusion_matrix(act_labels, pred_labels):
    uniqueLabels = list(set(act_labels))
    clusters = list(set(pred_labels))
    cm = [[0 for i in range(len(clusters))] for i in range(len(uniqueLabels))]
    for i, act_label in enumerate(uniqueLabels):
        for j, pred_label in enumerate(pred_labels):
            if act_labels[j] == act_label:
                cm[i][pred_label] = cm[i][pred_label] + 1
    return cm

# Example
labels=['a','b','c',
        'a','b','c',
        'a','b','c',
        'a','b','c']
pred=[  1,1,2,
        0,1,2,
        1,1,1,
        0,1,2]
cnf_matrix = confusion_matrix(labels, pred)
print('\n'.join([''.join(['{:4}'.format(item) for item in row])
      for row in cnf_matrix]))

Edit: (Dayyyuumm) just found that I could do this easily with Pandas Crosstab :-/.

labels=['a','b','c',
        'a','b','c',
        'a','b','c',
        'a','b','c']
pred=[  1,1,2,
        0,1,2,
        1,1,1,
        0,1,2]   

# Create a DataFrame with labels and varieties as columns: df
df = pd.DataFrame({'Labels': labels, 'Clusters': pred})

# Create crosstab: ct
ct = pd.crosstab(df['Labels'], df['Clusters'])

# Display ct
print(ct)
Evensong answered 10/12, 2017 at 6:48 Comment(1)
Vectorize your code with numpy to make it 10x faster.Yurikoyursa
Y
1

You can easily compute a pairwise intersection matrix.

But it may be necessary to do this yourself, if the sklearn library has been optimized for the classification use case.

Yurikoyursa answered 9/12, 2017 at 17:59 Comment(3)
Thanks, I was just looking if there's an OOTB way to do this before writing it myself.Evensong
There certainly exist such implementations. For example on graphs, you usually have a similarity and not a distance. But at some point, it becomes easier to write these things yourself rather than hacking around too much to glue together different libraries and then get bitten by all their bugs at once.Yurikoyursa
I wrote this myself and posted as a separate answer.Evensong

© 2022 - 2024 — McMap. All rights reserved.