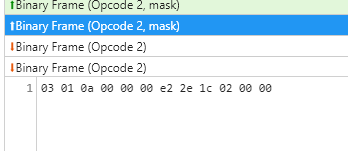
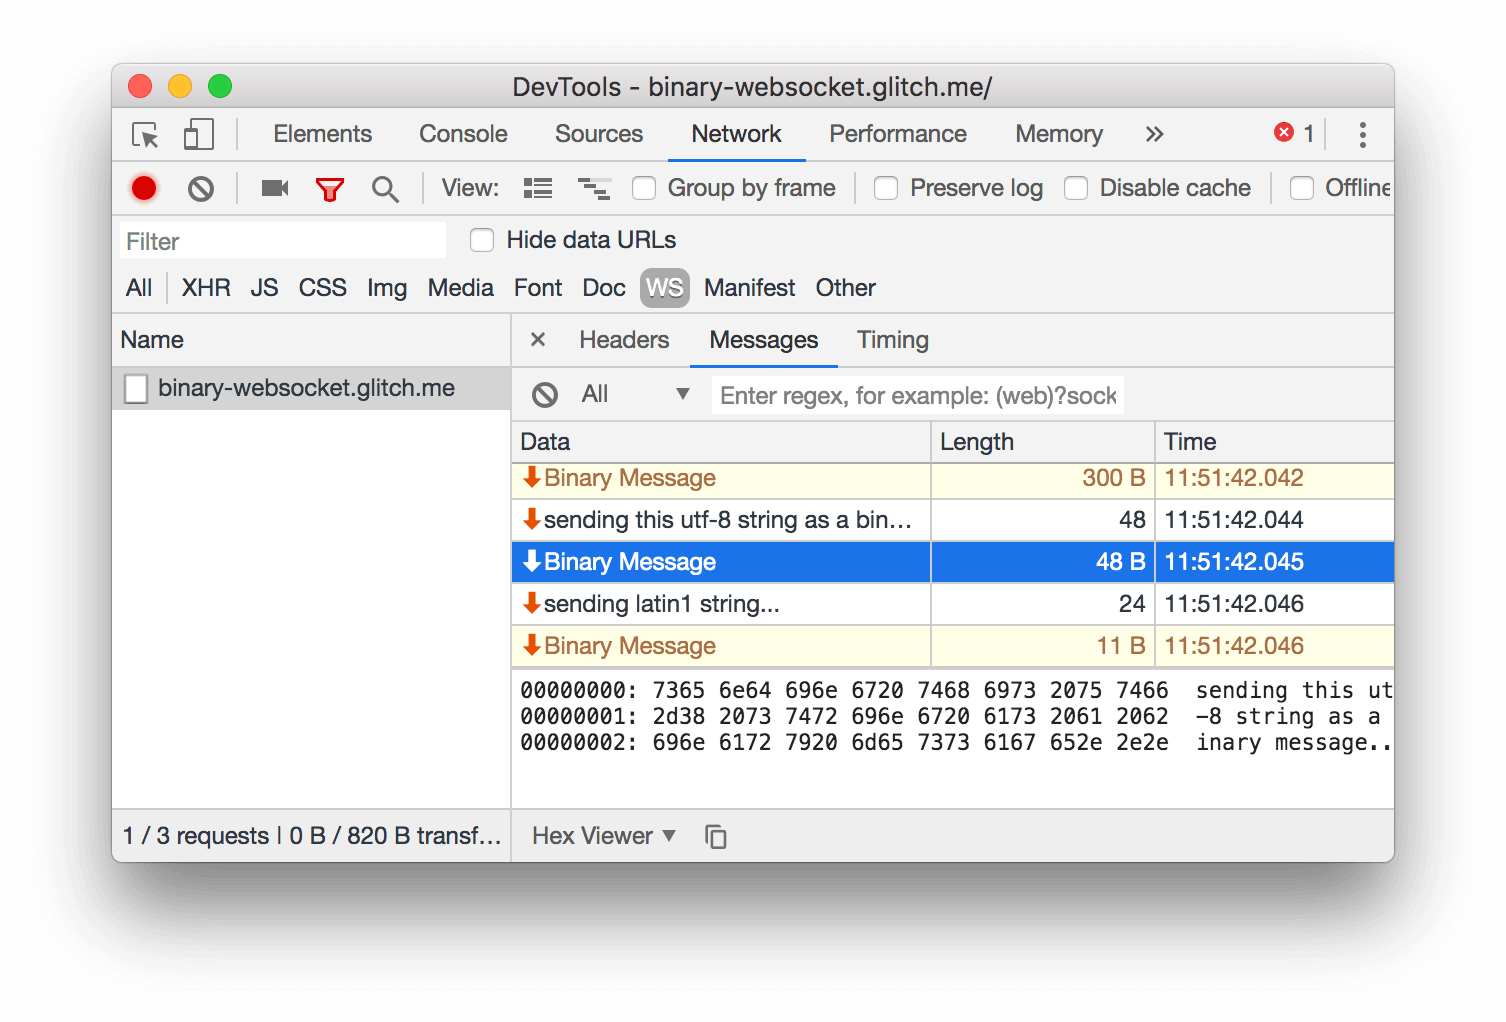
I'm trying to debug a web app using websockets to pass binary data. Chrome DevTools has this handy network tab that can display websocket frames... except for binary frames it just says Binary Frame (Opcode 2), and that's it. I have no idea why they stopped at this, when it is so easy to provide more information. I even found a pull request for this feature from 2 years ago.
Anyhow, I'm looking for alternatives. I'd also like to add some custom parsing logic for the binary data.
So far the best solution I've found - undock devtools window, open another devtools for the devtools (press Ctrl+Shift+I in Elements tab), navigate to source file for network tab, place a breakpoint on the line that sets frame's text content, and add JS code to modify local variables in edit breakpoint menu. I get something like this, which is pretty much perfect, but it is quite a hassle to set up, and difficult to use with more complex parsing code.
Ideally something like this would be done by a chrome extension, but it seems that devtools extensions can only go as far as catch regular network requests.
Another alternative is to use Wireshark, but this requires SSL key log, and then there's no clear documentation on how to make a custom dissector parse the output of SSL decoder instead of raw TCP data (there's a question about it here with no answer). Besides, I have a large amount of JS code for parsing the binary data, and translating everything into LUA would be quite a pain.
Update: I managed to make an extension for this using debugger API. This requires making your own UI that lists frames, but in the end it's working just as I wanted it.


