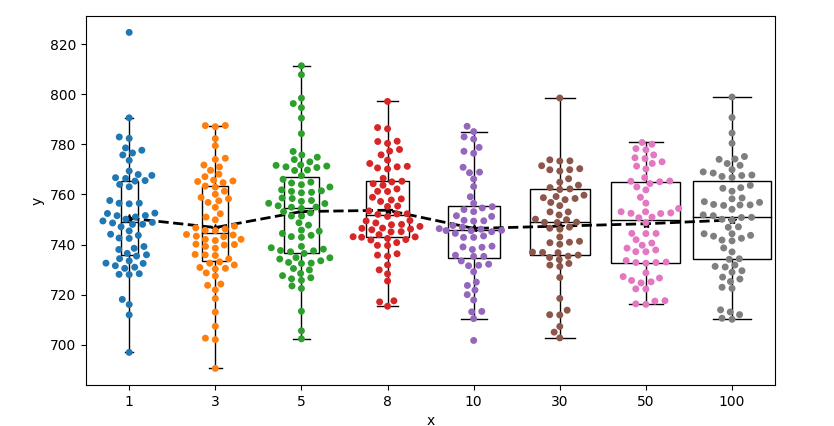
Seaborn's boxplot doesn't seem to understand the widths= parameter.
Here is a way to create a boxplot per x value via matplotlib's boxplot which does accept the width= parameter. The code below supposes the data is organized in a panda's dataframe.
from matplotlib import pyplot as plt
import numpy as np
import pandas as pd
import seaborn as sns

df = pd.DataFrame({'x': np.random.choice([1, 3, 5, 8, 10, 30, 50, 100], 500),
                   'y': np.random.normal(750, 20, 500)})
xvals = np.unique(df.x)
positions = range(len(xvals))
plt.boxplot([df[df.x == xi].y for xi in xvals],
            positions=positions, showfliers=False,
            boxprops={'facecolor': 'none'}, medianprops={'color': 'black'}, patch_artist=True,
            widths=[0.2, 0.3, 0.4, 0.5, 0.6, 0.7, 0.8, 0.9])
means = [np.mean(df[df.x == xi].y) for xi in xvals]
plt.plot(positions, means, '--k*', lw=2)
# plt.xticks(positions, xvals) # not needed anymore, as the xticks are set by the swarmplot
sns.swarmplot('x', 'y', data=df)
plt.show()
![example plot]()
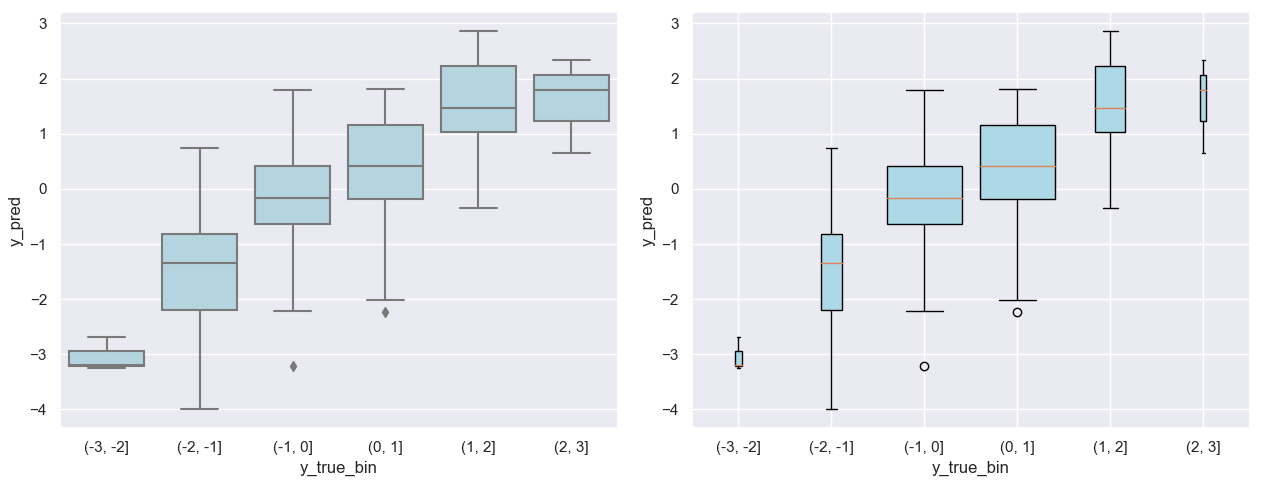
A related question asked how to set the box's widths depending on group size. The widths can be calculated as some maximum width multiplied by each group's size compared to the size of the largest group.
from matplotlib import pyplot as plt
import numpy as np
import pandas as pd
import seaborn as sns

y_true = np.random.normal(size=100)
y_pred = y_true + np.random.normal(size=100)
df = pd.DataFrame({'y_true': y_true, 'y_pred': y_pred})
df['y_true_bin'] = pd.cut(df['y_true'], range(-3, 4))

sns.set()
fig, (ax1, ax2) = plt.subplots(ncols=2, figsize=(12, 5))
sns.boxplot(x='y_true_bin', y='y_pred', data=df, color='lightblue', ax=ax1)

bins, groups = zip(*df.groupby('y_true_bin')['y_pred'])
lengths = np.array([len(group) for group in groups])
max_width = 0.8
ax2.boxplot(groups, widths=max_width * lengths / lengths.max(),
            patch_artist=True, boxprops={'facecolor': 'lightblue'})
ax2.set_xticklabels(bins)
ax2.set_xlabel('y_true_bin')
ax2.set_ylabel('y_pred')
plt.tight_layout()
plt.show()
![boxplot with widths depending on subset size]()


