Question
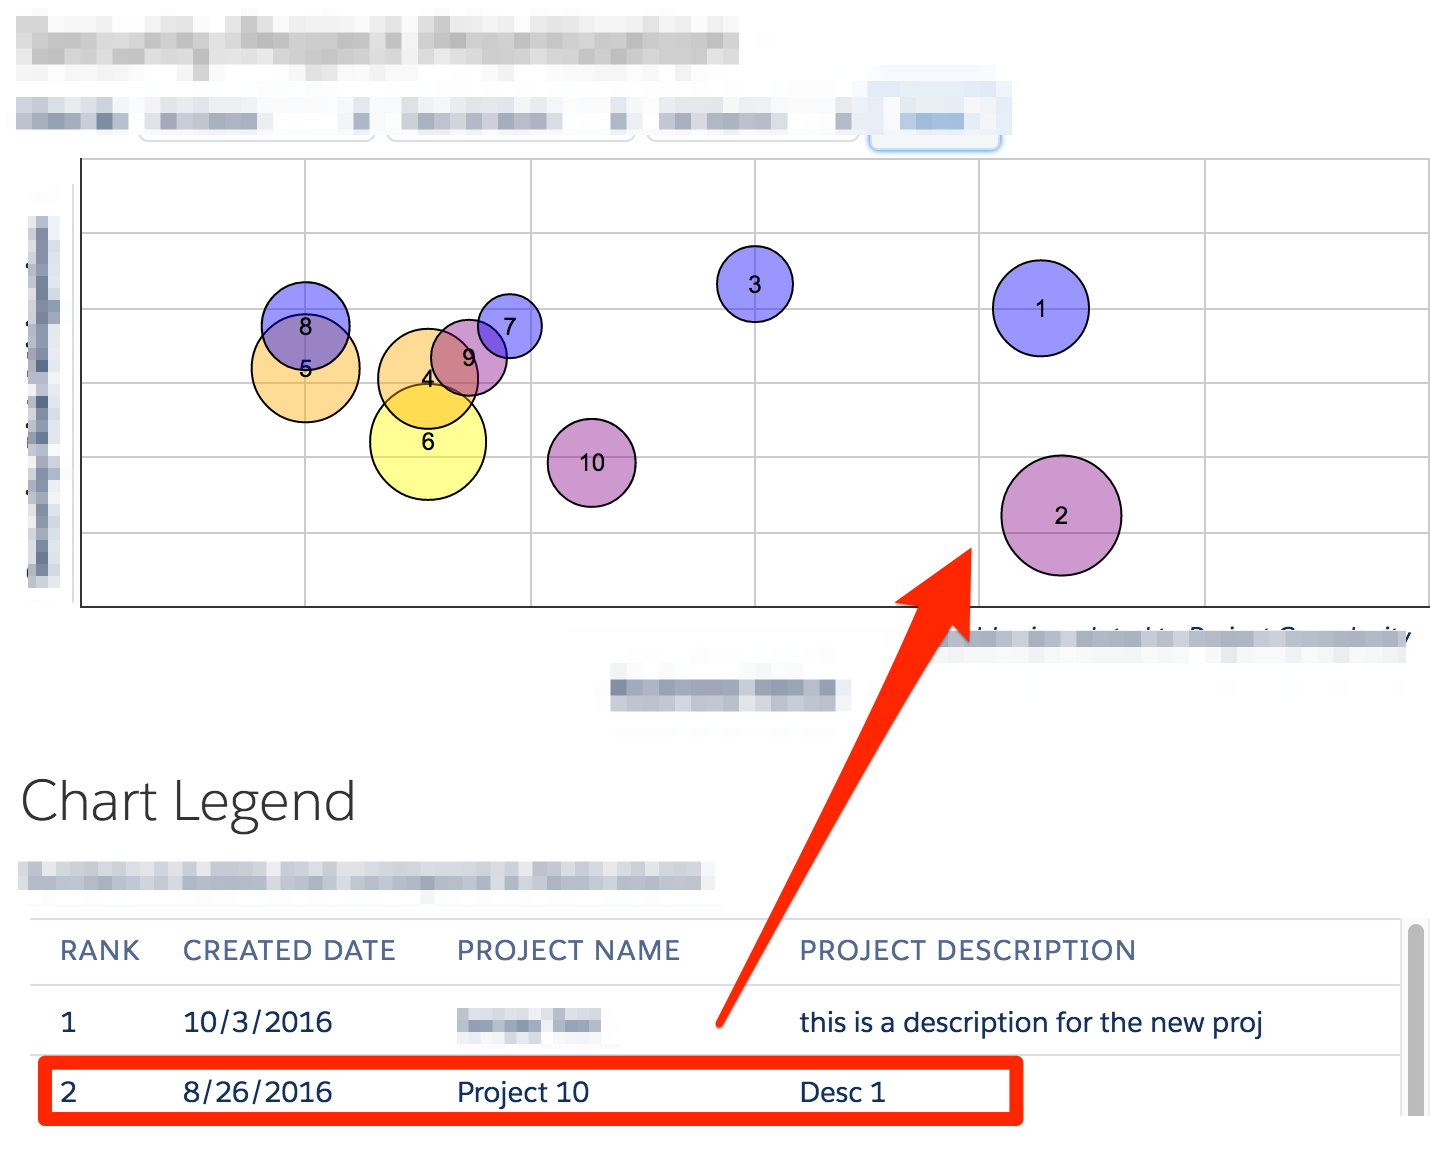
Is there any way to add labels to the individual bubbles in a Chart.js bubble chart without resorting to displaying tooltips at all times?
Background
The chart data is for visualizing our project backlog. Additional details, i.e. Project Name, about each project are in a table.
We previously used google charts, and just included the row number from the table on the bubble so you could match things up.

With Chart.js I only get the bubbles and tooltips.

I've reviewed the following related questions, but the solution they suggested requires having tooltips display at all times. I've got a lot more information in the tooltips and displaying them all the time would significantly clutter the chart.


afterDatasetsDrawis not being called. Do I have to call it bymyself somehow? – Cognition