For example, I want to choose two points from all the point clouds, and draw a line between them. I'm using Meshlab to deal with .ply files but I don't know how to accomplish this. Can I do this using Meshlab or other ways?
There is a way to add lines to .ply files. The most habitual elements found in .ply files are vertex and face, but the .ply file format also allows the definition of segments using the edge which are only partially supported by Meshlab.
This is a minimal example of a .ply file with two vertex and one edge element
ply
format ascii 1.0
comment object: A single line
element vertex 2
property float x
property float y
property float z
element edge 1
property int vertex1
property int vertex2
end_header
0 0 0
0 0 1
0 1
And this is a more complex example, with color per vertex and 4 lines in the corners of a cube.
ply
format ascii 1.0
comment object: 4 edges with color per vertex
element vertex 8
property float x
property float y
property float z
property uchar red
property uchar green
property uchar blue
element edge 4
property int vertex1
property int vertex2
end_header

0 0 0 255 0 0
0 0 1 255 0 0
0 1 1 255 0 0
0 1 0 255 0 0
1 0 0 0 0 255
1 0 1 0 0 255
1 1 1 0 0 255
1 1 0 0 0 255

0 4
1 5
2 6
3 7
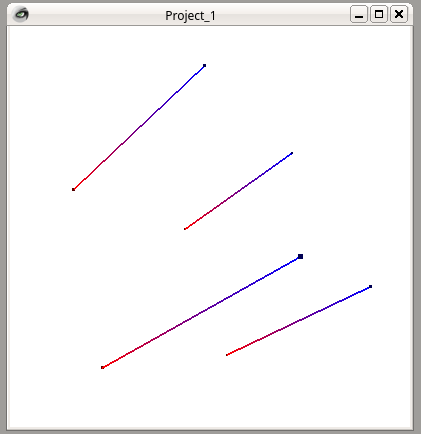
This is how previous example is rastered by meshlab
As I said, meshlab supports edge element just partially, so it has some problems:
- Meshlab will load .ply files with edge elements, but will not save then to ply file format. It will only export vertex and faces to file.
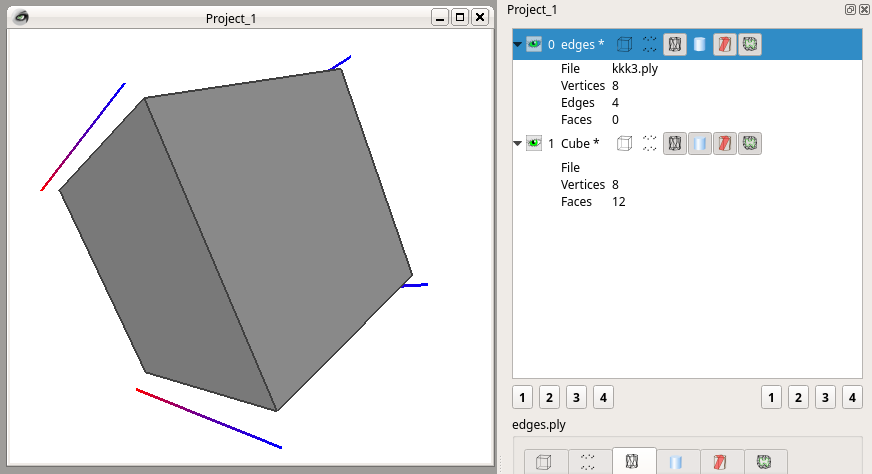
Meshlab has problems representing files with both
edgeandfaceelements. It will only correctly plot them if edges are in a separate layer from faces (as show in image below). So, if you need to plot a .ply file with both faces and lines, you will have to:- Duplicate the current layer.
- Select all faces from new layer and remove them (Del key), so the
edgeelements come visible on that layer. Thefaceelements are still visible in the original layer.
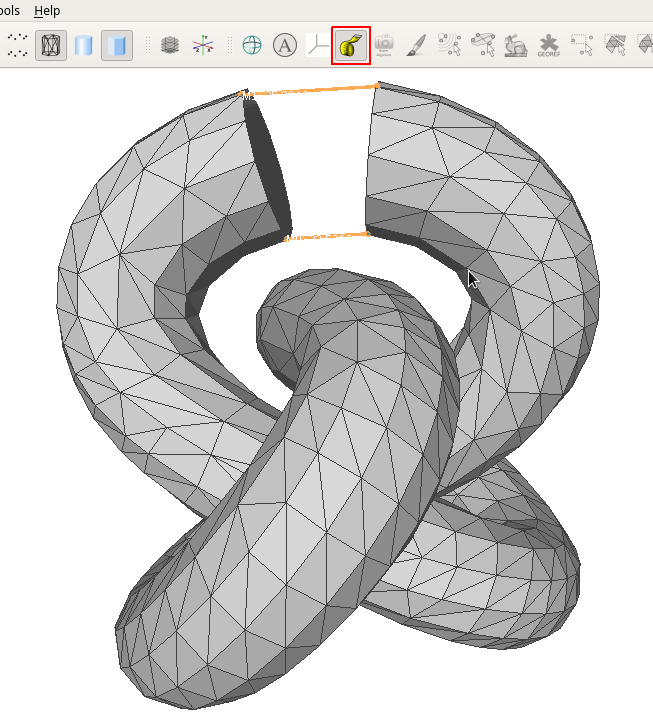
If you are just interested in draw some temporary segments on any mesh, you can just use the Measuring Tool to plot some lines. Keep in mind that those lines will be lost if you exit the measuring tool.
© 2022 - 2024 — McMap. All rights reserved.


