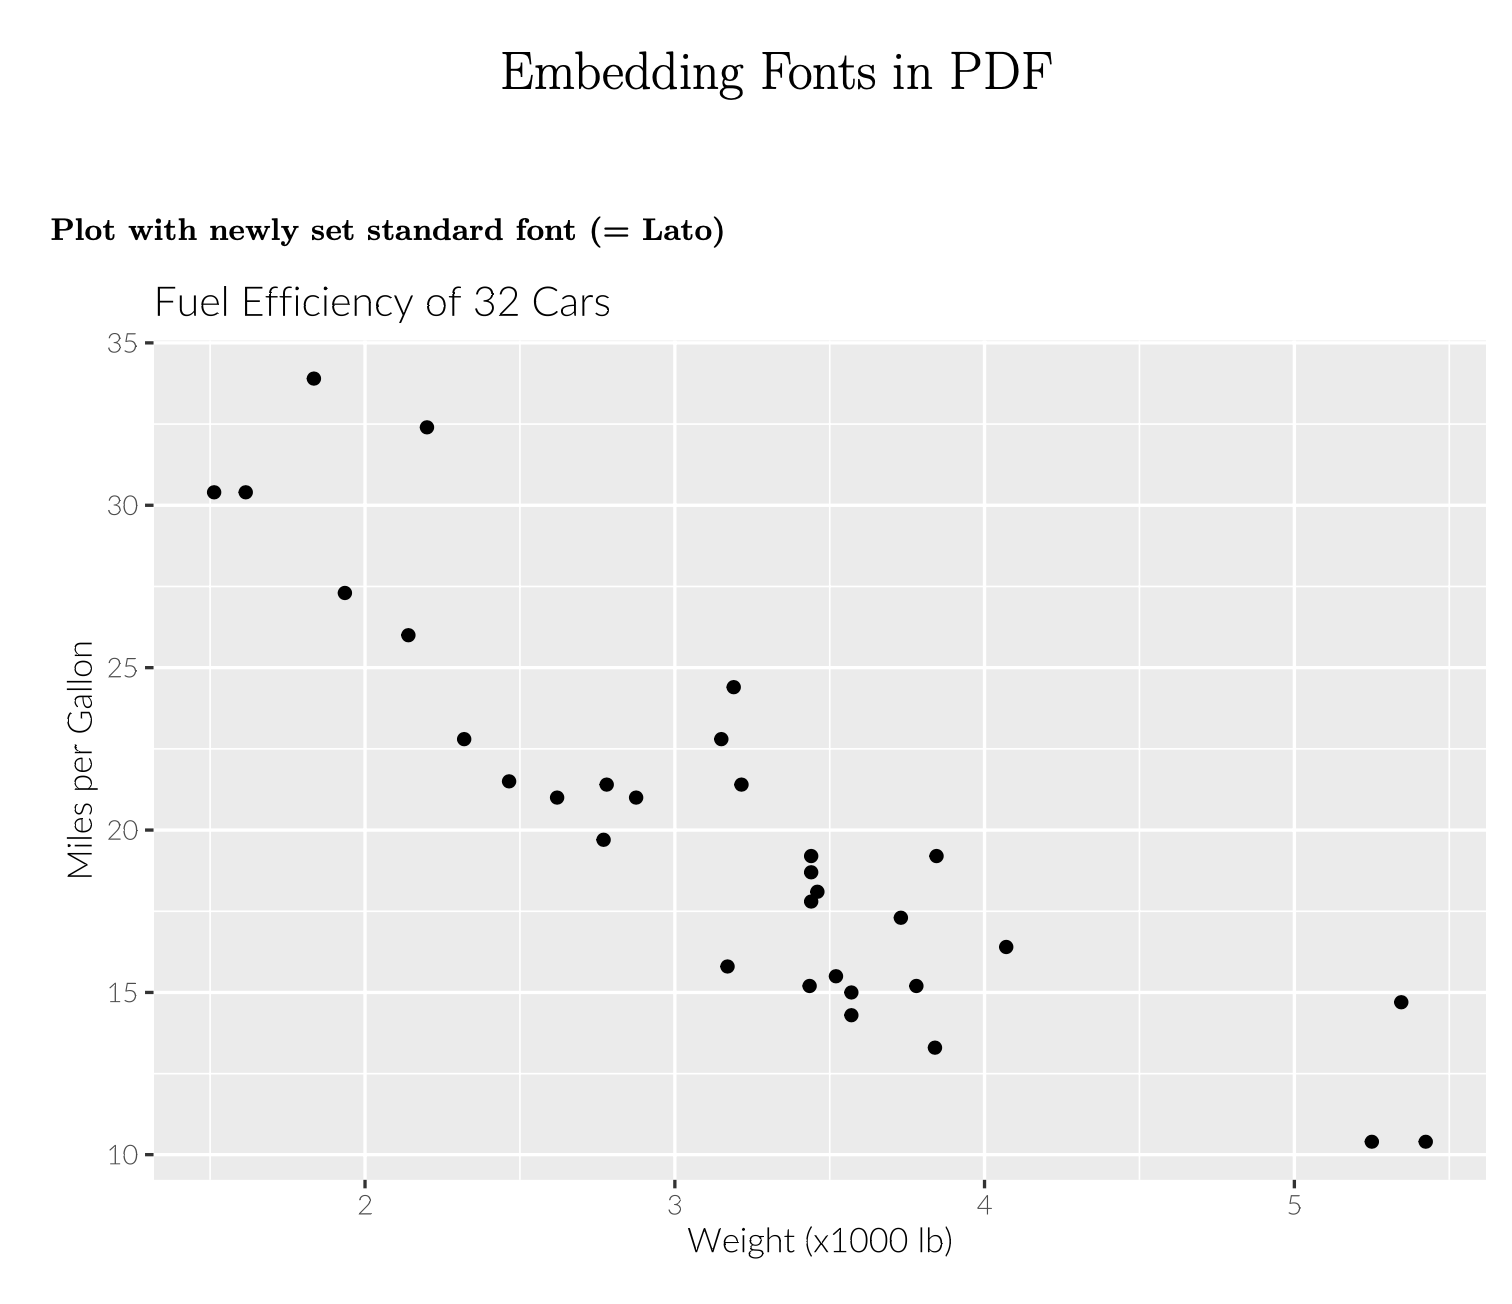
I would like to use the free font Lato in ggplot2 graphs since the remainder of my R markdown document is set in this font.
The font is installed on my system and available in the Font Book (once only).
All available fonts are loaded with the extrafont package and registered in the extrafontdb.
When I knit my markdown document as PDF, all text is correctly typeset in Lato. However, the plot labels of my ggPlots are not shown.
I also receive the following warning message:
Warning in grid.Call(C_textBounds, as.graphicsAnnot(x$label), x$x, x$y, : font width unknown for character 0x20
After embedding the fonts contained in the document with extrafont::embed_fonts the plot labels are shown for all figures using Lato as font, but
- the plot labels do not contain any spaces between words,
- any references (internal links, URLs, citations) do not work anymore.
An MWE including ggPlot figures with and without Lato as the font is provided below (Lato is freely available here)
To embed the fonts afterwards one needs to run embed_fonts("TestRmd.pdf", outfile="TestRmd_embedded.pdf")
Any help is greatly appreciated!
MWE:
---
title: "Embedding Fonts in PDF"
output: pdf_document
urlcolor: blue
---

```{r echo=FALSE}
library(ggplot2)
```

### Plot with standard font {#standard}
```{r echo=FALSE, out.width = '30%'}
ggplot(mtcars, aes(x=wt, y=mpg)) + geom_point() +
  ggtitle("Fuel Efficiency of 32 Cars") +
  xlab("Weight (x1000 lb)") + ylab("Miles per Gallon")
```

### Load fonts and set font for ggplots globally
```{r include=FALSE}
# install.packages("extrafont") # see https://github.com/wch/extrafont/
library(extrafont)
# font_import()   # run once
loadfonts()       # loadfonts

# globally set ggplot2 theme and font ("Lato Light")
theme_set(theme_minimal(base_size=12, base_family="Lato Light"))
```

### Plot with newly set standard font (= Lato) {#lato}
```{r echo=FALSE, out.width = '30%'}
ggplot(mtcars, aes(x=wt, y=mpg)) + geom_point() +
  ggtitle("Fuel Efficiency of 32 Cars") +
  xlab("Weight (x1000 lb)") + ylab("Miles per Gallon")
```

### Plot with Impact font {#impact}
```{r echo=FALSE, out.width = '30%'}
ggplot(mtcars, aes(x=wt, y=mpg)) + geom_point() +
  ggtitle("Fuel Efficiency of 32 Cars") +
  xlab("Weight (x1000 lb)") + ylab("Miles per Gallon") +
  theme(text=element_text(size=16, family="Impact"))
```

### Run to embed fonts
```{r eval=FALSE, include=TRUE}
embed_fonts("TestRmd.pdf", outfile="TestRmd_embedded.pdf")
```

### Links test

Links test 1 (internal reference): [Headline standard](#standard)

Links test 2 (URL): [RStudio has become a Public Benefit Corporation](https://blog.rstudio.com/2020/01/29/rstudio-pbc)
AddOn:
An even simpler problem but likely related to the same issue:
library(extrafont)
extrafont::font_import()
p <- ggplot(iris, aes(Sepal.Length, Sepal.Width)) + geom_point() + theme_minimal(base_size=10, base_family="Lato Light")
ggsave(p, filename = "iris.pdf")
The plot in the saved pdf does not contain any labels. Using cairo_pdf as recommend on several SO (e.g. 1, 2) sites does not help and results in the following error:
ggsave(p, filename = "iris.pdf", device = cairo_pdf)
# In dev(filename = filename, width = dim[1], height = dim[2], ...) :
#   failed to load cairo DLL


showtextpackage, which works indeed! However, when I use this approach the document size of the knited PDF is much, much larger than if embedding the fonts (my 15mb report with extrafont turned into a gigantic 190mb file). – Burnett