Jetbrains Rider: Show "external code" in debugger call stack
Asked Answered
C

1

8

In Rider, is there a way to actually show the "external code" in the debugger stack frames, when paused at a breakpoint? enter image description here
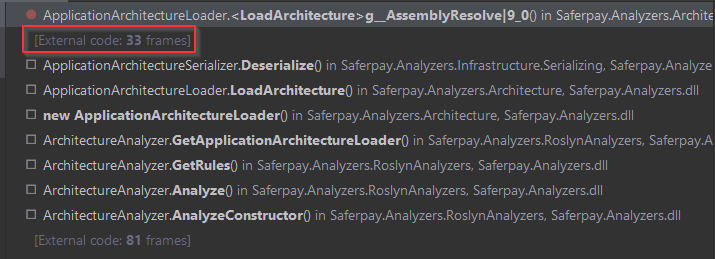
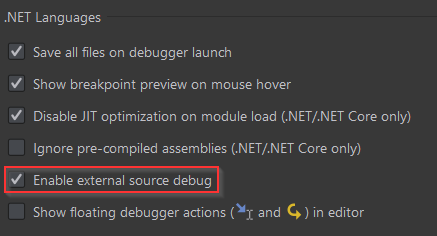
In Visual Studio, this can be done easily, but in Rider it seems impossible. And, yes, I enabled "exable external source debug": enter image description here
Castlereagh answered 16/11, 2020 at 12:59 Comment(0)
D
5

Currently, there is this action for expanding external frames. In RIDER 2021.2 EAP 1 we are introducing another action in the context menu (which can be activated by right click on the stack frames panel) to make this setting less confusing. See for details

Delve answered 5/5, 2021 at 11:29 Comment(0)

© 2022 - 2024 — McMap. All rights reserved.