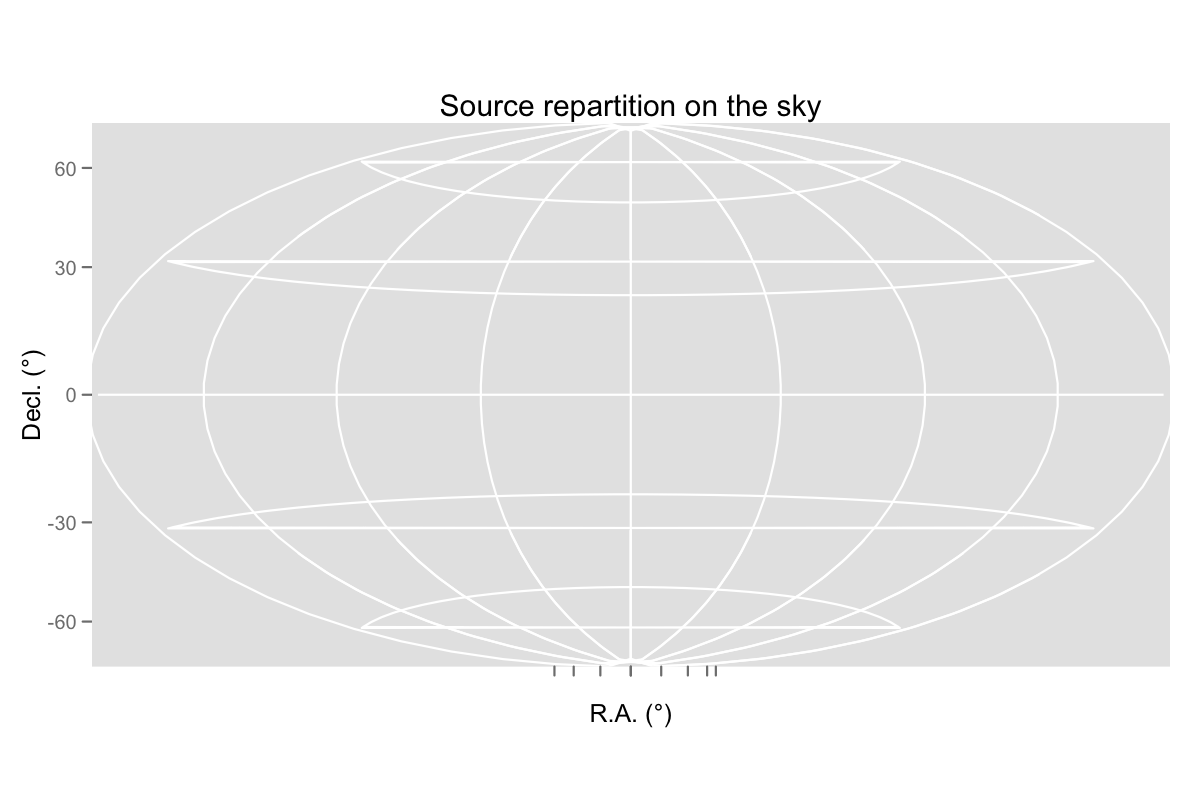
I am trying to plot celestial object on the sky (basically with coordinates equivalent to latitude/longitude). I successfully plotted all my points using the "aitoff" projection of the coord_map function, but in this case, the grid is badly displayed, i.e. residual horizontal lines are still displayed for latitudes non equal to zero along with their correct projections.
How could I remove these lines?
Here is code that reproduces the behavior:
library(ggplot2)
library(mapproj)
sky2 = data.frame(RA=0, Dec=0)
skyplot2 <- qplot(RA,Dec,data=sky2,xlim=c(0,360),ylim=c(-89.999,89.999),
xlab="R.A.(°)", ylab="Decl. (°)",main="Source repartition on the sky")
skyplot2 + coord_map(projection="aitoff",orientation=c(89.999,180,0)) +
scale_y_continuous(breaks=(-2:2)*30,limits=c(-89.999,89.999)) +
scale_x_continuous(breaks=(0:8)*45,limits=c(0,360),
                   labels=c("","","","","","","","",""))


