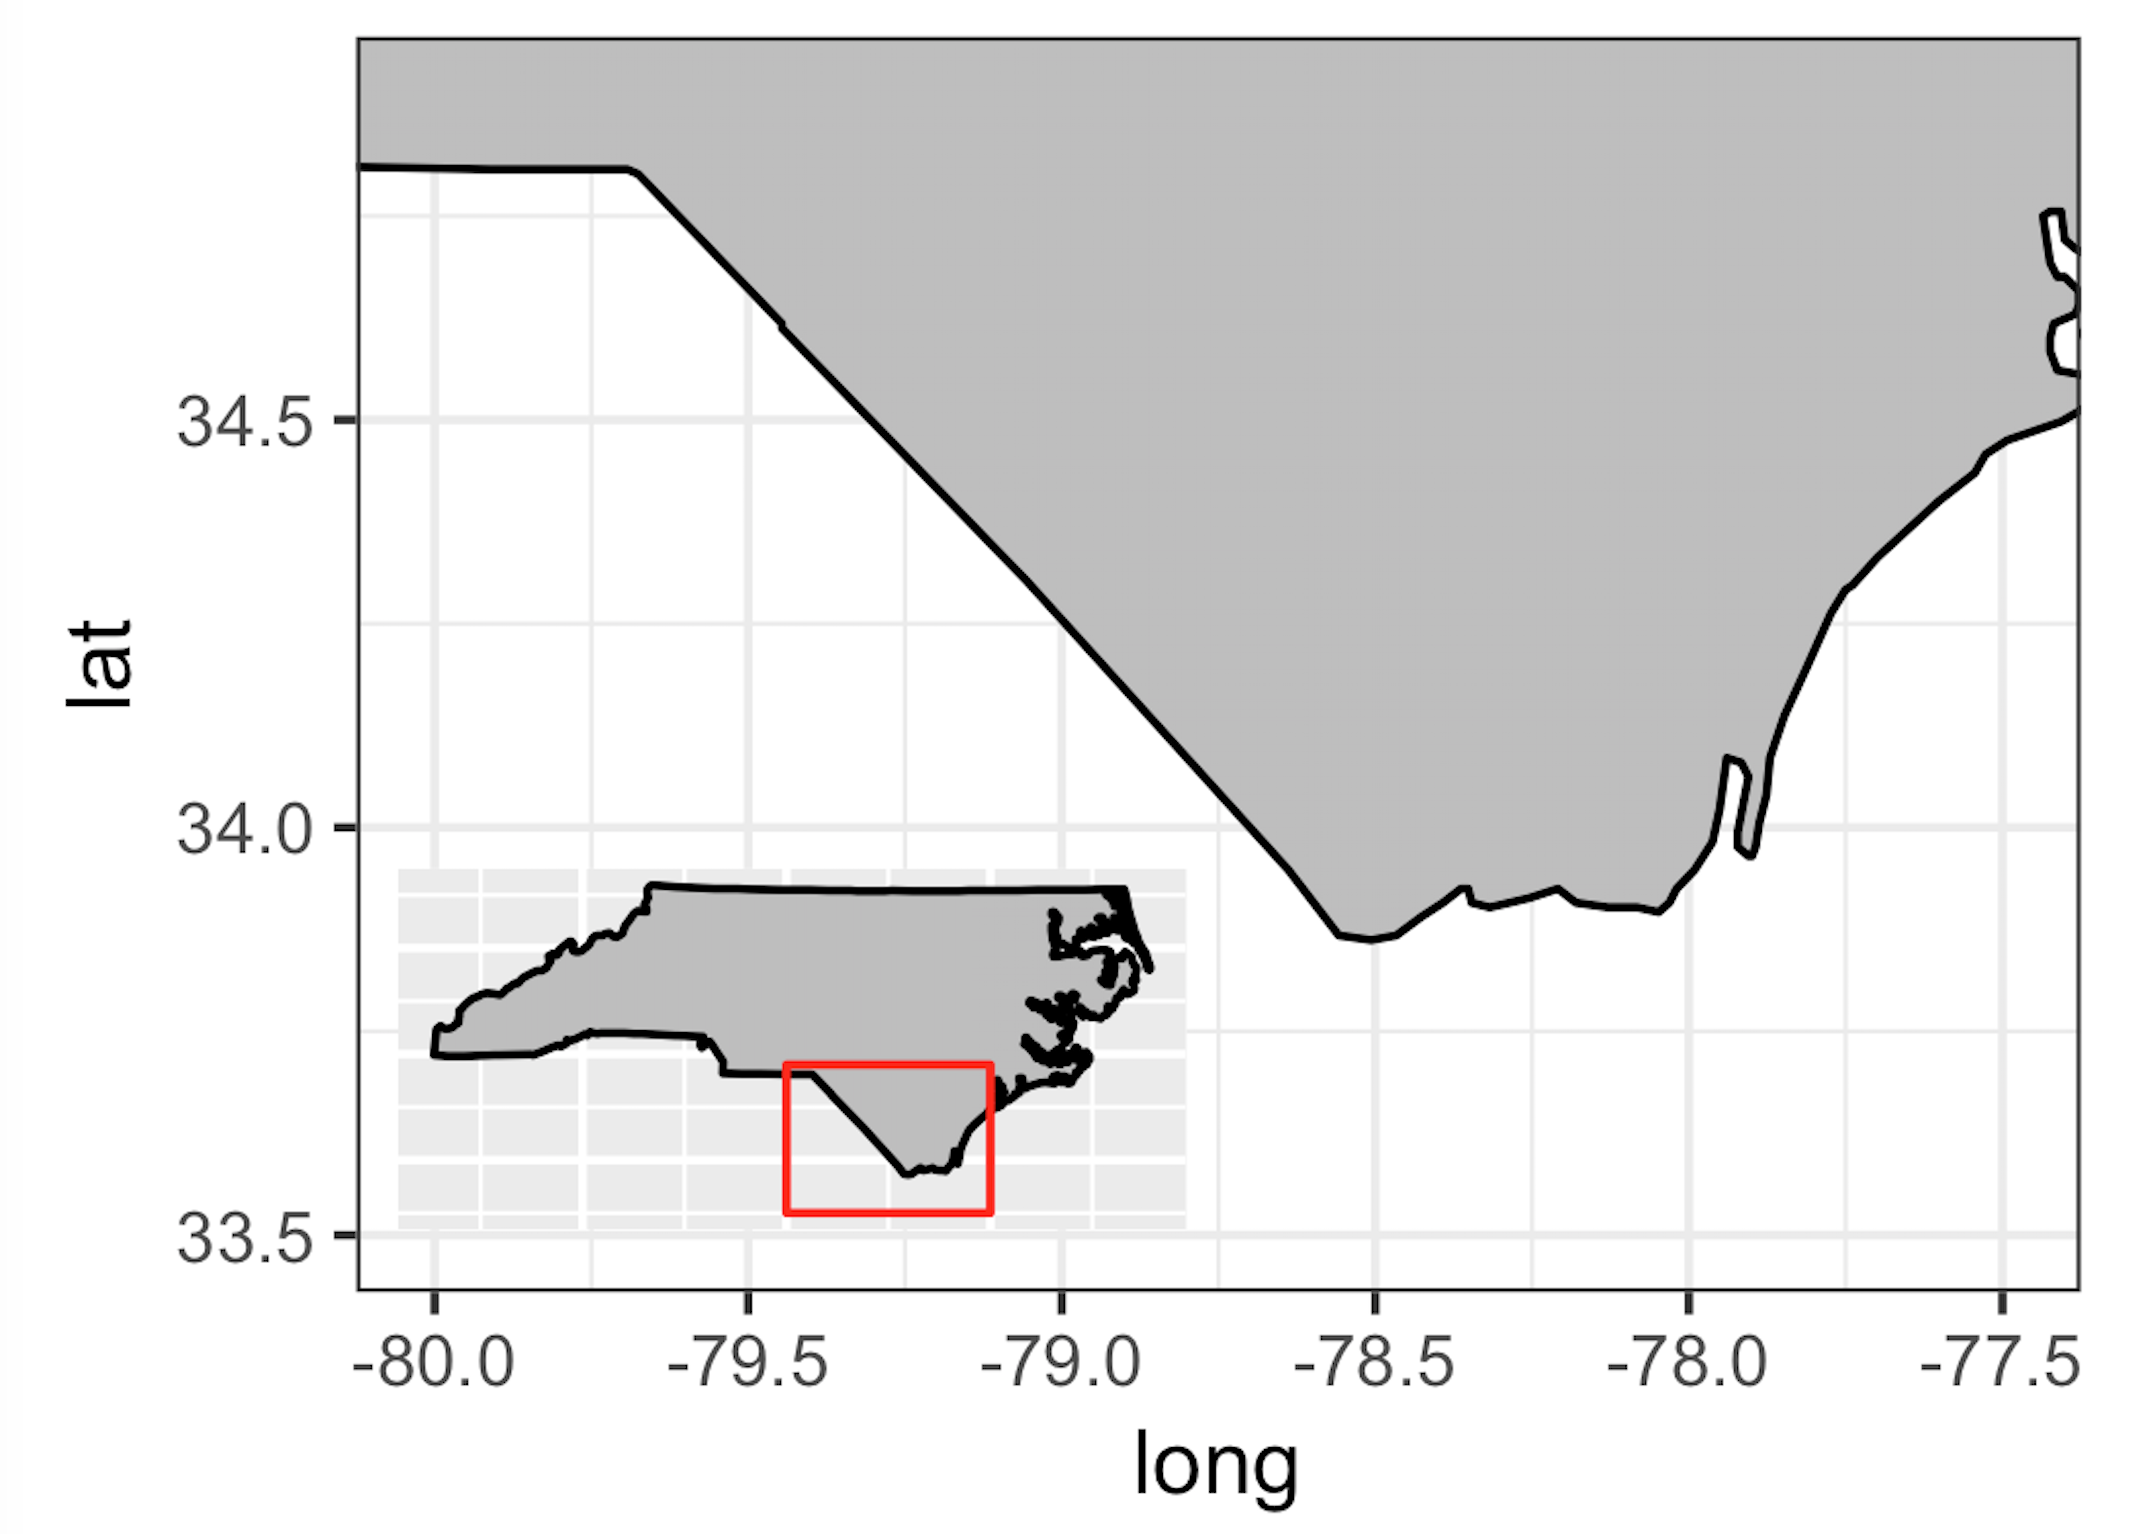
I'm just trying to make a simple study area map that also contains an inset of the state that I am working in (North Carolina). I would like to convert the inset map to a grob object to plot it within the main study area map, then use ggsave to save the map as an image, pdf, etc. I am using shapefiles for my actual map, but I'll show you what I am trying for using map_data:
library(ggplot2)
library(ggmap)
library(maps)
library(mapdata)
library(gridExtra)
library(grid)

# get the NC data:
states <- map_data("state")
nc_df <- subset(states, region == "north carolina")

# study area map:
nc_base <- ggplot() +
geom_polygon(data = nc_df, aes(x = long, y = lat, group = group), fill="grey", color="black") +
coord_fixed(xlim=c(-80, -77.5), ylim=c(33.5, 34.9), ratio = 1.3) +
theme_bw()
nc_base

# inset map:
insetmap<-ggplot() +
geom_polygon(data = nc_df, aes(x = long, y = lat, group = group), fill="grey", color="black")  + # get the state border back on top
coord_fixed(ratio = 1.3) +
annotate(geom = "rect", ymax = 34.9, ymin = 33.5, xmax = -77.5, xmin = -80, colour = "red", fill = NA) +
ylab("") +
xlab("") +
theme_nothing()
insetmap

insetmap.grob <- ggplotGrob(insetmap)

final_map <- nc_base + annotation_custom(insetmap.grob, xmin=-79.5, xmax=-79, ymin=33.75, ymax=34)
final_map
When I run the script to produce the final map, only the study area map is produced. I'm wondering if I'm using ggplotGrob incorrectly, or it is something else? I might have read elsewhere that the annotation_custom function does not work unless you are using the coord_cartesian function in ggplot2 (and here I am using coord_fixed). If that is the case, can I zoom in similarly with that function, or is there another coord_ function to zoom in on my study area map?
Thanks, Jay

