I'm experiencing a performance hit when preloading SKTextureAtlas:
let textureAtlas = SKTextureAtlas(named: atlasName)
textureAtlas.preload(completionHandler: {
    ...
})
By performance hit, I mean FPS dropping to ~50 for a short amounts of time.
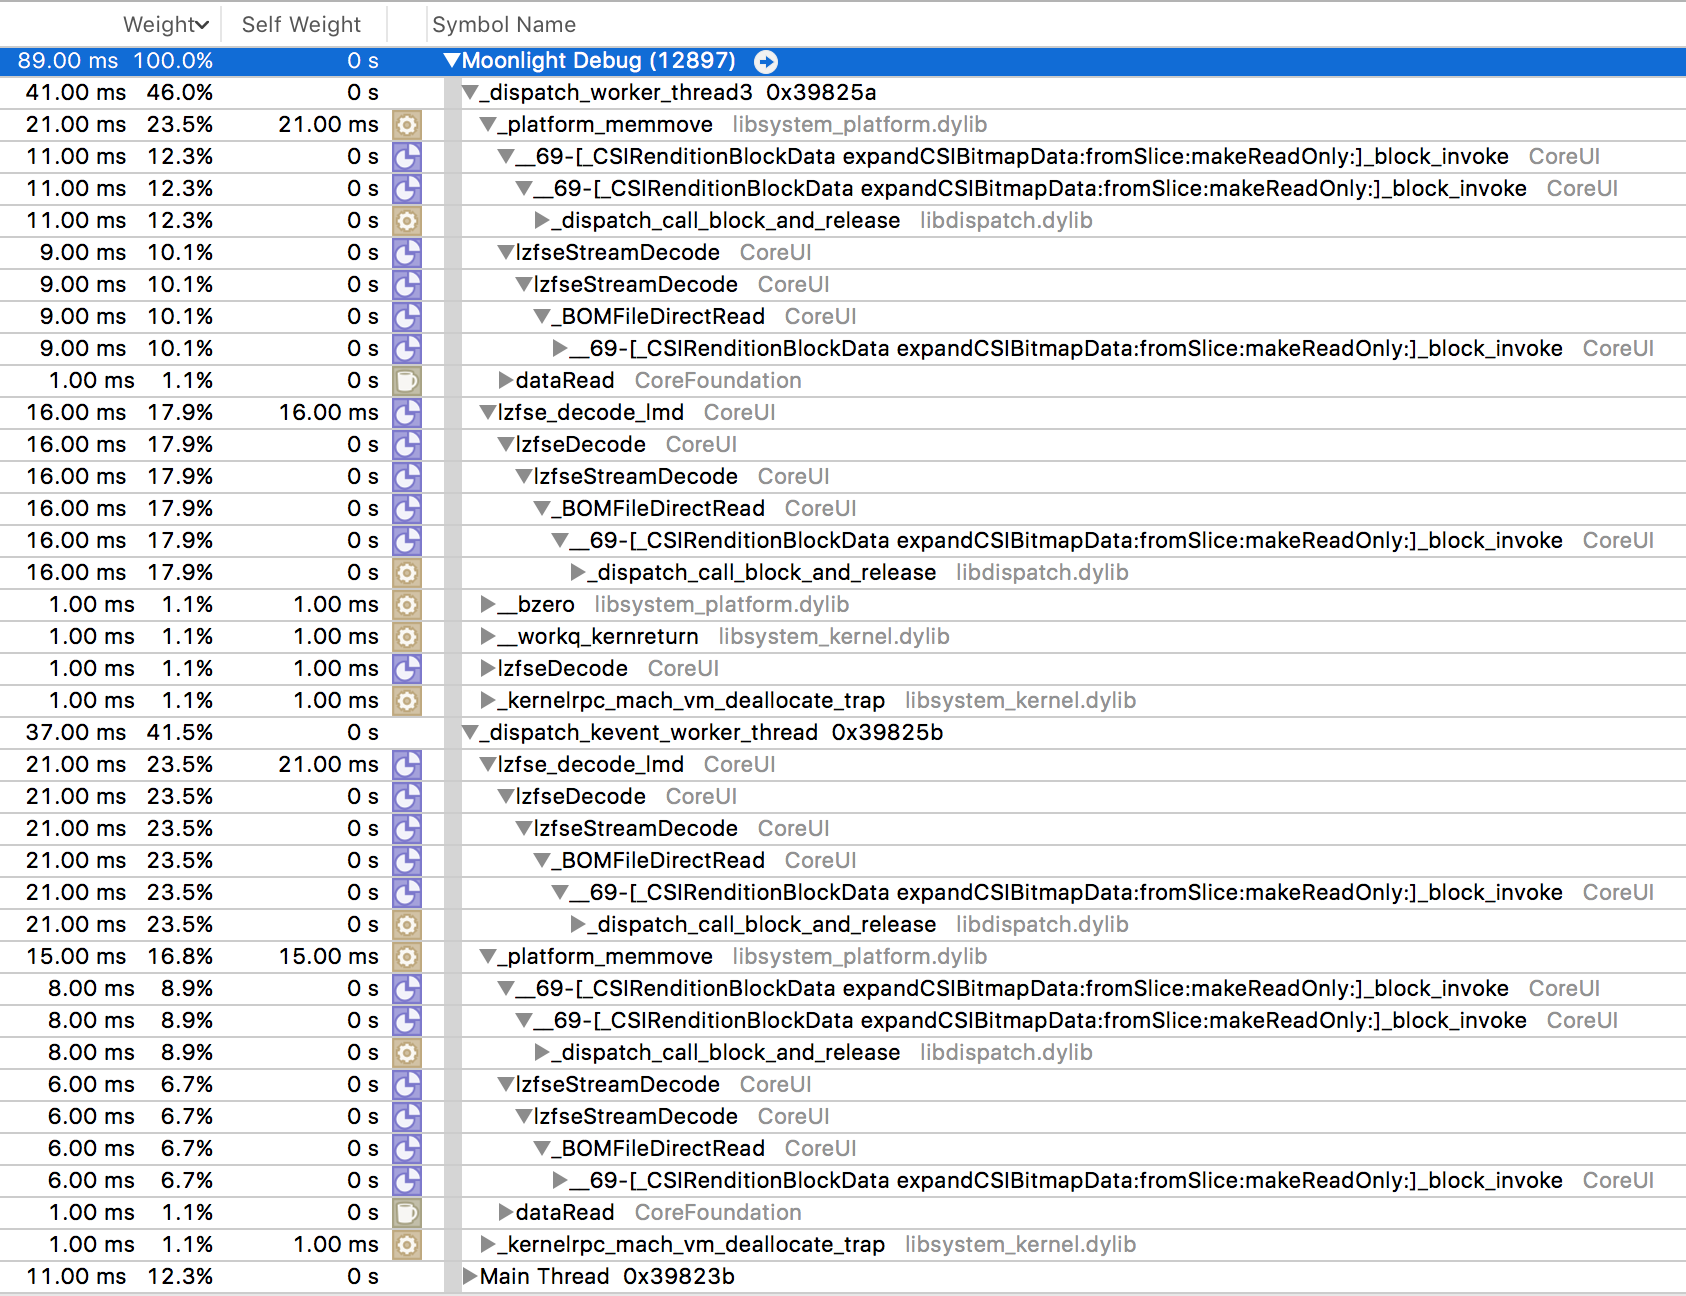
I tested it with Time Profiler in Instruments and verified that this work is indeed being done on a worker thread, like stated in documentation.
The image bellow shows a Time Profiler capture of the spike, caused by preloading atlas. As you can see, most of the spike is caused by 2 worker threads, which all seem to be loading image data, as far as I can understand. However, this should not cause a performance hit on the main thread IMHO.
Note 1: The .spriteatlas I'm preloading is not that big: 4 assets with approx. 1000x1000 size.
Note 2: I'm testing with iPhone 6, iOS 10, Xcode 8.
Note 3: There is no other substantial work being done at the same time; CPU is hovering at ~30% all the time. Same goes for GPU.
Note 4: The atlas preload is requested way before any of the textures from that atlas is needed, so it should have more than enough time to preload.
Any help/direction greatly appreciated!
UPDATE
Complete code block where the preload happens:
let updateGroup = DispatchGroup()

for assetDefinition in assetContainmentDefinitions {

    let assetName = assetDefinition.assetName

    // Check if asset is not needed anymore and clear the cache with it
    if progress >= assetDefinition.range.to {
        if cachedAssets[assetName] != nil {
            cachedAssets[assetName] = nil
        }
    }
    // Check if asset is needed and if it's not already loading then preload and cache it
    else if progress >= assetDefinition.range.from {

        if currentlyLoadingAssets.contains(assetName) == false &&
            cachedAssets[assetName] == nil {

            currentlyLoadingAssets.append(assetName)

            // Enter dispatch group
            updateGroup.enter()

            switch assetDefinition.assetType {
            case .textureAtlas:

                let textureAtlas = SKTextureAtlas(named: assetName)
                textureAtlas.preload(completionHandler: {

                    DispatchQueue.main.async { [weak self] in

                        self?.cachedAssets[assetName] = textureAtlas
                        self?.currentlyLoadingAssets.remove(object: assetName)

                        // Leave dispatch group after preload is done
                        updateGroup.leave()
                    }
                })

            case .texture:

                let texture = SKTexture(imageNamed: assetName)
                texture.preload(completionHandler: {

                    DispatchQueue.main.async { [weak self] in

                        self?.cachedAssets[assetName] = texture
                        self?.currentlyLoadingAssets.remove(object: assetName)

                        // Leave dispatch group after preload is done
                        updateGroup.leave()
                    }
                })
            }
        }
    }
}

// Call completion after the dispatch group is fully completed
if let completion = completion {
    updateGroup.notify(queue: DispatchQueue.main, execute: completion)
}
UPDATE 2
I've created an empty project with nothing but atlas preload block. The performance drop still occurs. I've tried with multiple atlases, even with atlas with only one asset.
I've also tried what @Sez suggested (see bellow), in this empty new project, but in that case the completion block didn't even get called, which seems like another bug in SKTextureAtlas class. (?!)
let atlas = SKTextureAtlas(dictionary: ["texture1": UIImage(named: "texture1")!])

atlas.preload(completionHandler: { [weak self] in
    print("COMPLETION BLOCK NOT CALLED")
    self?.cachedAtlas = atlas
})
UPDATE 3
I tried deleting the .spriteatlas and creating the .atlas with the same textures and there is (almost) no performance hit. However, .atlas doesn't support slicing which is why I want to use .spriteatlas in the first place.


atlas.preload(completionHandler:)block and I still experience the same issue. Tried with multiple different atlases. – Mimosaceous