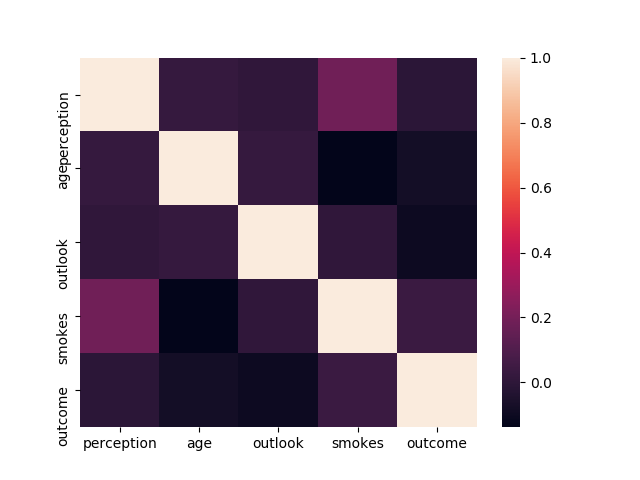
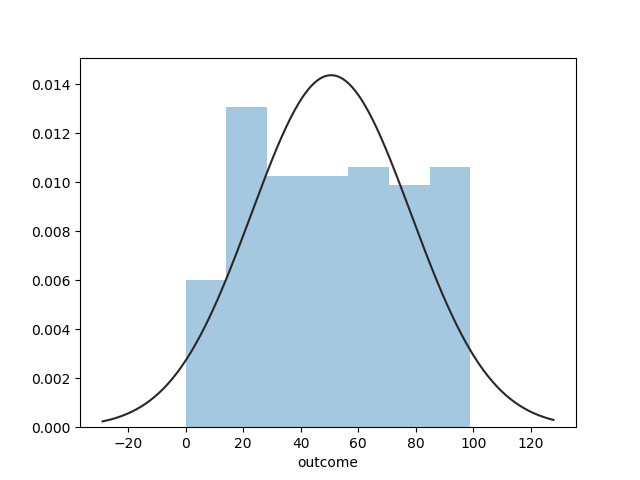
To prepare a little toy example:
import pandas as pd
import numpy as np

high, size = 100, 20
df = pd.DataFrame({'perception': np.random.randint(0, high, size),
                   'age': np.random.randint(0, high, size),
                   'outlook': pd.Categorical(np.tile(['positive', 'neutral', 'negative'], size//3+1)[:size]),
                   'smokes': pd.Categorical(np.tile(['lots', 'little', 'not'], size//3+1)[:size]),
                   'outcome': np.random.randint(0, high, size)
                  })
df['age_range'] = pd.Categorical(pd.cut(df.age, range(0, high+5, size//2), right=False,
                             labels=["{0} - {1}".format(i, i + 9) for i in range(0, high, size//2)]))
np.random.shuffle(df['smokes'])
Which will give you something like:
In [2]: df.head(10)
Out[2]:
   perception  age   outlook  smokes  outcome age_range
0          13   65  positive  little       22   60 - 69
1          95   21   neutral    lots       95   20 - 29
2          61   53  negative     not        4   50 - 59
3          27   98  positive     not       42   90 - 99
4          55   99   neutral  little       93   90 - 99
5          28    5  negative     not        4     0 - 9
6          84   83  positive    lots       18   80 - 89
7          66   22   neutral    lots       35   20 - 29
8          13   22  negative    lots       71   20 - 29
9          58   95  positive     not       77   90 - 99
Goal: figure out likelihood of outcome, given {perception, age, outlook, smokes}.
Secondary goal: figure out how important each column is in determining outcome.
Third goal: prove attributes about distribution (here we have randomly generated, so a random distribution should imply the null hypothesis is true?)
Clearly these are all questions findable with statistical hypothesis testing. What's the right way of answering these questions in pandas?


categorical variable treatment. The question can further be enriched by asking how to measure the interplay between categorical and continuous variables. Think about it. – Montane