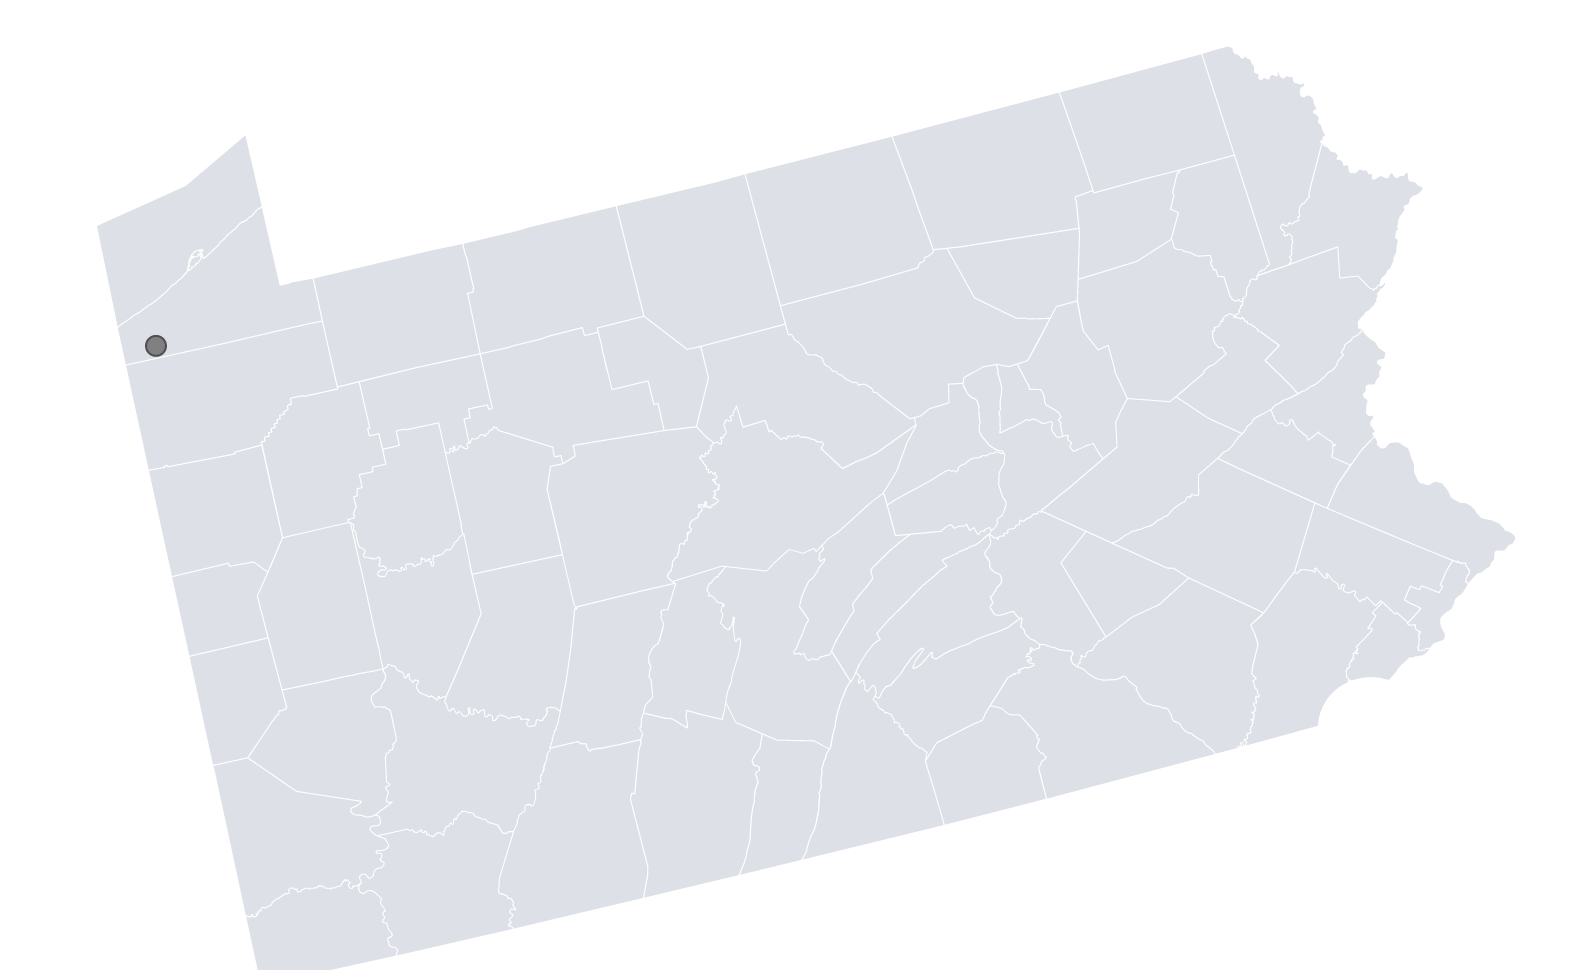
I know this questions has been asked but the op didn't provide any code and I can't edit his answer obviously, so I'll start a new one. My objective is to replace the dot with a custom drop-pin marker that I will eventually have some other action for it. So as a kicker, such action must be identified somehow (perhaps and id) so that I can call it from jQuery, CSS, or javascript and give it some use.
Background:
I extracted the map of Pennsylvania from jVectorMaps and the code from the section that explains how to use marker images from this link marker-icons.
This is the original code:
$(function(){
   var plants = [
   {name: 'KKG', coords: [49.9841308, 10.1846373], status: 'activeUntil2018'},
   {name: 'KKK', coords: [53.4104656, 10.4091597], status: 'closed'},
   {name: 'KWG', coords: [52.0348748, 9.4097793], status: 'activeUntil2022'},
   {name: 'KBR', coords: [53.850666, 9.3457603], status: 'closed', offsets: [0, 5]}
];

new jvm.Map({
   container: $('#map'),
   map: 'de_merc',
   markers: plants.map(function(h){ return {name: h.name, latLng: h.coords} }),
   labels: {
      markers: {
        render: function(index){
          return plants[index].name;
        },
        offsets: function(index){
          var offset = plants[index]['offsets'] || [0, 0];

          return [offset[0] - 7, offset[1] + 3];
        }
      }
   },
   series: {
     markers: [{
       attribute: 'image',
       scale: {
         'closed': '/img/icon-np-3.png',
         'activeUntil2018': '/img/icon-np-2.png',
         'activeUntil2022': '/img/icon-np-1.png'
       },
       values: plants.reduce(function(p, c, i){ p[i] = c.status; return p }, {}),
       legend: {
         horizontal: true,
         title: 'Nuclear power station status',
         labelRender: function(v){
           return {
           closed: 'Closed',
           activeUntil2018: 'Scheduled for shut down<br> before 2018',
           activeUntil2022: 'Scheduled for shut down<br> before 2022'
         }[v];
        }
      }
    }]
   }
  });
});
And this is my version which it does display the map, it does display the location, but only as a dot, not the marker. (See screenshot below) p.s. I don't care about the legend. I'm doing something else for that.
My code:
//------------- Vector maps -------------//
     var prison = [
       {name: 'Albion', coords: [41.890611, -80.366454], status: 'active', offsets: [0, 2]}
];


$('#pa-map').vectorMap({
    map: 'us-pa_lcc_en',
    scaleColors: ['#f7f9fe', '#29b6d8'],
    normalizeFunction: 'polynomial',
    hoverOpacity: 0.7,
    hoverColor: false,
    backgroundColor: '#fff',
    regionStyle:{
        initial: {
            fill: '#dde1e7',
            "fill-opacity": 1,
            stroke: '#f7f9fe',
            "stroke-width": 0,
            "stroke-opacity": 0
        },
        hover: {
            "fill-opacity": 0.8
        },
        selected: {
            fill: 'yellow'
        }
    },
    markers: prison.map(function(h){ return {name: h.name, latLng: h.coords} }),
    labels: {
        markers: {
          render: function(index){
            return prison[index].name;
          },
          offsets: function(index){
            var offset = prison[index]['offsets'] || [0, 0];

            return [offset[0] - 7, offset[1] + 3];
          }
        }
    },
    series: {
      markers: [{
        attribute: 'image',
        scale: { 'active': '/img/map-marker-icon.png'},
        values: prison.reduce(function(p, c, i){ p[i] = c.status; return p }, {}),
      }]
    }
});
My HTML:
<div id="pa-map" style="width: 100%; height: 470px"></div>
My CSS:
Irrelevant. I'll design accordingly later.
Thank you in advance!


$.vectorMap()andnew jvm.Map()– Canner