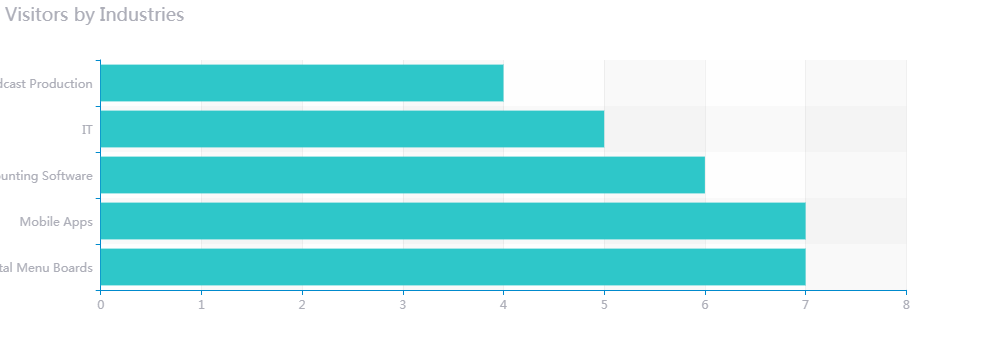
I have user ngEcharts (angularjs plugin of Echarts). When i implement bar chart yaxis labels are cutting off.
can anyone point me on the direction to how to prevent this or increase yAxis label area or decrease chart area?
I have user ngEcharts (angularjs plugin of Echarts). When i implement bar chart yaxis labels are cutting off.
can anyone point me on the direction to how to prevent this or increase yAxis label area or decrease chart area?
After Ovilia's link i was able to remove cut off using it's grid property.
It has containLabel property.
Once i set containLabel it to true, i didn't need to set grid size. it worked!
If anyone still facing truncation issue after implementing above accepted answer.
Add left: 0; (or some positive integer value) to grid property along with containLabel: true;
i.e
grid: {containLabel: true, left: 0};
Add this to the chart init configuration object. It will fix the cut-off labels
grid: { containLabel: true },
© 2022 - 2024 — McMap. All rights reserved.