Firstly, a big shout out to this example: https://www.c-sharpcorner.com/UploadFile/ca9151/google-charts-api-using-database-in-Asp-Net/ If you want a simple walk-through of building a Google Chart, then that is perfect.
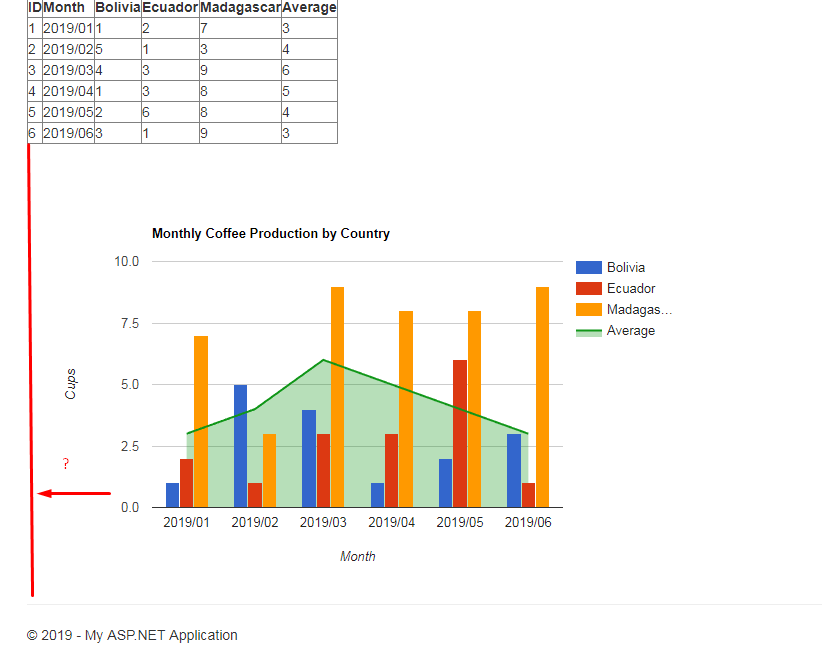
In saying that ... both in that example, and on the one in my project ... I can't get the chart to start at the left of the designated section. it keeps indenting. It's worse when I hide the axis labels as the space just becomes larger due to the lack of words.
Does anyone know how to make them take up 100% of the width? (in the image, i want the chart to start at the red line and go all the way to the other side of the div)
Thanks in advance.

