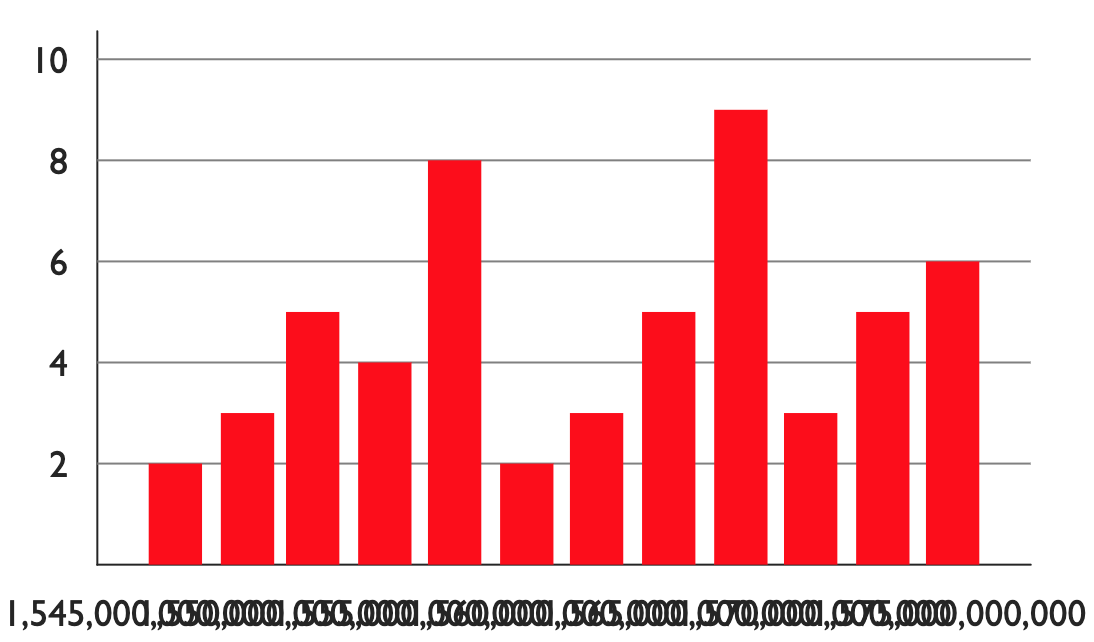
How to control Victory x axis ticks labels
Asked Answered
P

2

8

I'm using Victory to render a data set:

class App extends React.Component {
  render() {
    return (
      <div style={{ width: 600 }}>
        <VictoryChart domainPadding={30}>
          <VictoryAxis
            dependentAxis={true}
            style={{
              grid: { stroke: "grey" }
            }}
          />
          <VictoryAxis />
          <VictoryBar
            barWidth={20}
            style={{ data: { fill: "red" } }}
            data={[
              { x: new Date("2019-01-01"), y: 2 },
              { x: new Date("2019-02-01"), y: 3 },
              { x: new Date("2019-03-01"), y: 5 },
              { x: new Date("2019-04-01"), y: 4 },
              { x: new Date("2019-05-01"), y: 8 },
              { x: new Date("2019-06-01"), y: 2 },
              { x: new Date("2019-07-01"), y: 3 },
              { x: new Date("2019-08-01"), y: 5 },
              { x: new Date("2019-09-01"), y: 9 },
              { x: new Date("2019-10-01"), y: 3 },
              { x: new Date("2019-11-01"), y: 5 },
              { x: new Date("2019-12-01"), y: 6 }
            ]}
          />
        </VictoryChart>
      </div>
    );
  }
}

Screenshot

How can I change the x-axis to render a tick for each month ("jan", "feb", "mar" etc.)? Further, I would like each bar to have a width of 40 px (barWidth=40), but when I do that all bars are just merged - I would like to control the margin/padding between the bars as well. How should this be solved?

An example is available in this sandbox: https://codesandbox.io/s/victory-react-native-4t49q

Pinette answered 11/9, 2019 at 13:11 Comment(0)
C
8

You may show labels as x-axis ticks. Then to control margin/padding you may set container's width a bit wider to fit bolder bars.

import React from "react";
import { render } from "react-dom";
import { VictoryChart, VictoryBar, VictoryAxis, VictoryContainer, VictoryLabel } from "victory";

class App extends React.Component {
  render() {

    let month = new Array(12);
    month[0] = "January";
    month[1] = "February";
    month[2] = "March";
    month[3] = "April";
    month[4] = "May";
    month[5] = "June";
    month[6] = "July";
    month[7] = "August";
    month[8] = "September";
    month[9] = "October";
    month[10] = "November";
    month[11] = "December";

    return (
      <div style={{ width: 600 }}>
        <VictoryChart domainPadding={30}
            width={900}
            containerComponent={<VictoryContainer responsive={false}/>}>
          <VictoryAxis
            dependentAxis={true}
            style={{
              grid: { stroke: "grey" }
            }}
          />
          <VictoryAxis 
            tickFormat={(x) => ``}
          />
          <VictoryBar
            barWidth={50}
            padding={{ left: 20, right: 60 }}
            style={{ data: { fill: "red" } }}
            data={[
              { x: new Date("2019-01-01"), y: 2 },
              { x: new Date("2019-02-01"), y: 3 },
              { x: new Date("2019-03-01"), y: 5 },
              { x: new Date("2019-04-01"), y: 4 },
              { x: new Date("2019-05-01"), y: 8 },
              { x: new Date("2019-06-01"), y: 2 },
              { x: new Date("2019-07-01"), y: 3 },
              { x: new Date("2019-08-01"), y: 5 },
              { x: new Date("2019-09-01"), y: 9 },
              { x: new Date("2019-10-01"), y: 3 },
              { x: new Date("2019-11-01"), y: 5 },
              { x: new Date("2019-12-01"), y: 6 }
            ]}
            labels={( datum ) => `${month[datum.x.getMonth()]}`}
            labelComponent={<VictoryLabel y={250} verticalAnchor={"start"}/>}
          />
        </VictoryChart>
      </div>
    );
  }
}

render(<App />, document.getElementById("root"));

As a sandbox: link

Christiansand answered 16/9, 2019 at 11:3 Comment(0)
L
0

You can try. Added comments where changes are Needed

class App extends React.Component {
  render() {
    return (
      <div>
      <VictoryChart
          domainPadding={30}
          width={700} // Width should be more as we are updating barWidth
        >
         <VictoryAxis
            dependentAxis={true}
            style={{
              grid: { stroke: "grey" }
            }}
          />
          <VictoryAxis  tickFormat={x => ''} /> // remove existing labels
          <VictoryBar
            barWidth={40}
            style={{ data: { fill: "red" } }}
            labels={( datum ) => {  return `${datum.x.toLocaleString('default', { month: 'short' })}`}} // get labels as month name
            labelComponent={
              <VictoryLabel y={270} 
                verticalAnchor={"start"} 
                angle={90}
              />
          }
            data={[
              { x: new Date("2019-01-01"), y: 2 },
              { x: new Date("2019-02-01"), y: 3 },
              { x: new Date("2019-03-01"), y: 5 },
              { x: new Date("2019-04-01"), y: 4 },
              { x: new Date("2019-05-01"), y: 8 },
              { x: new Date("2019-06-01"), y: 2 },
              { x: new Date("2019-07-01"), y: 3 },
              { x: new Date("2019-08-01"), y: 5 },
              { x: new Date("2019-09-01"), y: 9 },
              { x: new Date("2019-10-01"), y: 3 },
              { x: new Date("2019-11-01"), y: 5 },
              { x: new Date("2019-12-01"), y: 6 }
            ]}
          />
        </VictoryChart>
      </div>
    );
  }
}
Ludmilla answered 23/9, 2019 at 6:5 Comment(0)

© 2022 - 2024 — McMap. All rights reserved.