Java hashCode(): Override faster that native implementation?
Asked Answered
M

2

8

I am bit surprised that the default (native) implementation of the hashCode() method appears ~50x slower than a simple override of the method for the following benchmark.

Consider a basic Book class that does not override hashCode():

public class Book {
private int id;
private String title;
private String author;
private Double price;

public Book(int id, String title, String author, Double price) {
    this.id = id;
    this.title = title;
    this.author = author;
    this.price = price;
}
}

Consider, alternatively, an otherwise identical Book class, BookWithHash, that overrides the hashCode() method using the default implementation from Intellij:

public class BookWithHash {
private int id;
private String title;
private String author;
private Double price;


public BookWithHash(int id, String title, String author, Double price) {
    this.id = id;
    this.title = title;
    this.author = author;
    this.price = price;
}

@Override
public boolean equals(final Object o) {
    if (this == o) return true;
    if (o == null || getClass() != o.getClass()) return false;

    final BookWithHash that = (BookWithHash) o;

    if (id != that.id) return false;
    if (title != null ? !title.equals(that.title) : that.title != null) return false;
    if (author != null ? !author.equals(that.author) : that.author != null) return false;
    return price != null ? price.equals(that.price) : that.price == null;
}

@Override
public int hashCode() {
    int result = id;
    result = 31 * result + (title != null ? title.hashCode() : 0);
    result = 31 * result + (author != null ? author.hashCode() : 0);
    result = 31 * result + (price != null ? price.hashCode() : 0);
    return result;
}
}

Then, the results of the following JMH benchmark suggests to me that the default hashCode() method from the Object class is almost 50x slower than the (seemingly more complex) implementation of hashCode() in the BookWithHash class:

public class Main {

public static void main(String[] args) throws RunnerException {
    Options opt = new OptionsBuilder().include(Main.class.getSimpleName()).forks(1).build();
    new Runner(opt).run();
}

@Benchmark
@BenchmarkMode(Mode.AverageTime)
@OutputTimeUnit(TimeUnit.MILLISECONDS)
public long bookWithHashKey() {
    long sum = 0L;
    for (int i = 0; i < 10_000; i++) {
        sum += (new BookWithHash(i, "Jane Eyre", "Charlotte Bronte", 14.99)).hashCode();
    }
    return sum;
}

@Benchmark
@BenchmarkMode(Mode.AverageTime)
@OutputTimeUnit(TimeUnit.MILLISECONDS)
public long bookKey() {
    long sum = 0L;
    for (int i = 0; i < 10_000; i++) {
        sum += (new Book(i, "Jane Eyre", "Charlotte Bronte", 14.99)).hashCode();
    }
    return sum;
}
}

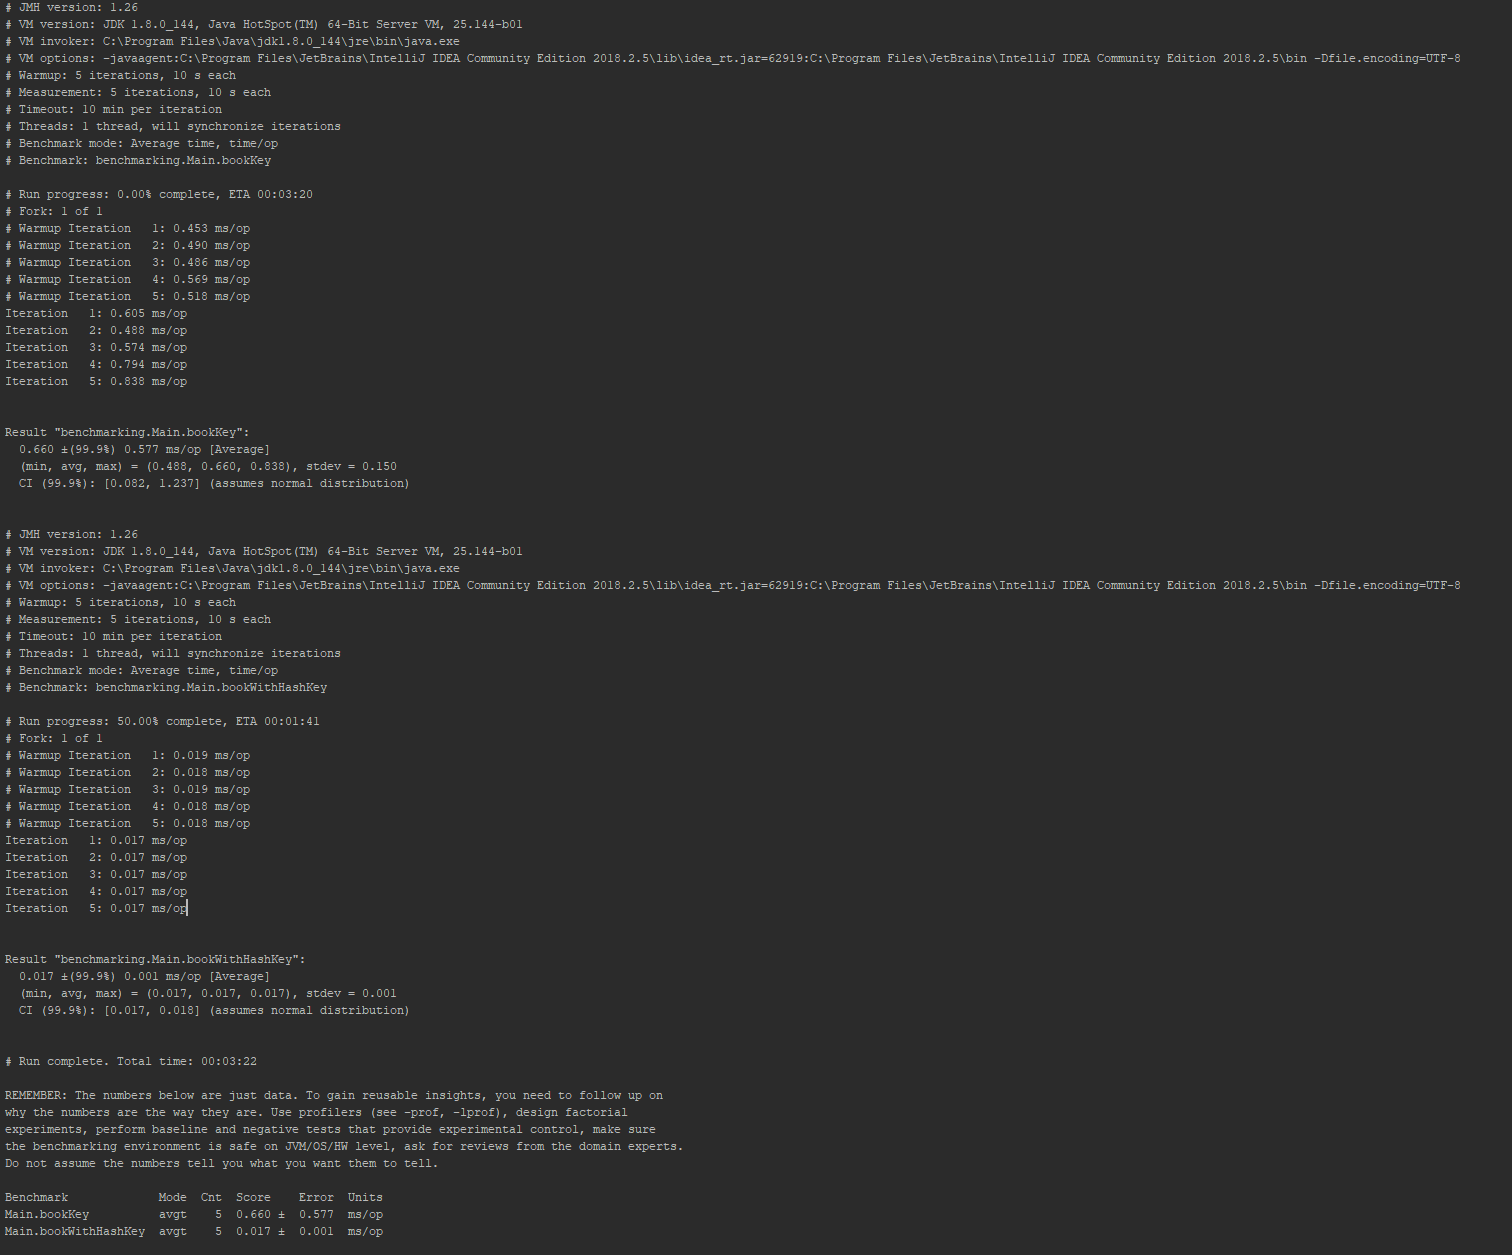
Indeed, the summarized results suggest that calling hashCode() on the BookWithHash class is an order of magnitude faster than calling hashCode() on the Book class (see below for full JMH output): Summarized JMH

The reason I am surprised by this is that I understand the default Object.hashCode() implementation to (usually) be a hash of the initial memory address for the object, which (for the memory lookup at least) I would expect to be exceedingly fast at the microarchitecure level. These results seem to suggest to me that the hashing of the memory location is the bottleneck in Object.hashCode(), when compared to the simple override as given above. I would appreciate others' insights into my understanding and what could be causing this surprising behavior.


Full JMH output:

Full JMH output

Maltz answered 16/11, 2020 at 0:49 Comment(5)
You should actually do something with the hashcodes (like summing them up) so the whole loop isn't just optimized out due to not modifying any data.Agamogenesis
@Agamogenesis good idea, I updated the benchmark as suggested (summing the hash codes). Results do differ from before but still 50x difference.Maltz
I don't have JMH but I did a simple repetitive test and got similar results as you. But by simply putting in public int hashCode() { return 0;} in the nohash version, they both took about the same amount of time.Poche
I got about the same results as @Poche , however on scale of 1 bilion repetitions the native hash actually always outperformed overriden hash by about 0.5s.Tolerate
FWIW the default hashCode impl uses a thread local variation of Marsaglia's xor-shift to compute the value (github.com/openjdk/jdk/blob/master/src/hotspot/share/runtime/…), and then stores it in the object header. In the best case the cached value can be loaded from the object header, but since you're creating new objects every time, I think you're hitting the slow path each time, which is an out-of-line native call (i.e. relatively slow, since none of that can be optimized).Stevestevedore
T
6

You have misused JMH, so the benchmark scores do not have much sense.

  1. It's usually not needed to run something in a loop inside a benchmark. JMH runs a benchmark loop itself in a way that prevents JIT compiler overoptimizing the code being measured.
  2. Results and side effects of the code being measured need to be consumed, either by calling Blackhole.consume or by returning the result from a method.
  3. The parameters of the code are typically read from @State variables in order to avoid constant folding and constant propagation.

In your case, BookWithHash objects are transient: JIT realizes the objects do not escape, and eliminates allocation altogether. Furthermore, since some of the object fields are constant, JIT can simplify hashCode computation by using constants instead of reading the object fields.

On the contrary, the default hashCode relies on the object identity. That's why the allocation of Book cannot be eliminated. So, your benchmark is actually comparing the allocation of 20000 objects (mind the Double object) with some arithmetic operations on the local variables and constants. No surprise, the latter is much faster.

Another thing to take into account is that the first call of identity hashCode is much slower than the subsequent calls, because the hashCode needs to be first generated and put into the object header. This in turn requires a call to VM runtime. The second and the subsequent calls of hashCode will just get the cached value from the object header, and this indeed will be much faster.

Here is a corrected benchmark that compares 4 cases:

  • getting (generating) an identity hashCode of a new object;
  • getting an identity hashCode of an existing object;
  • computing an overridden hashCode of a newly created object;
  • computing an overridden hashCode of an existing object.
@State(Scope.Benchmark)
public class HashCode {

    int id = 123;
    String title = "Jane Eyre";
    String author = "Charlotte Bronte";
    Double price = 14.99;

    Book book = new Book(id, title, author, price);
    BookWithHash bookWithHash = new BookWithHash(id, title, author, price);

    @Benchmark
    public int book() {
        return book.hashCode();
    }

    @Benchmark
    public int bookWithHash() {
        return bookWithHash.hashCode();
    }

    @Benchmark
    public int newBook() {
        return (book = new Book(id, title, author, price)).hashCode();
    }

    @Benchmark
    public int newBookWithHash() {
        return (bookWithHash = new BookWithHash(id, title, author, price)).hashCode();
    }
}
Benchmark                 Mode  Cnt   Score   Error  Units
HashCode.book             avgt    5   2,907 ± 0,032  ns/op
HashCode.bookWithHash     avgt    5   5,052 ± 0,119  ns/op
HashCode.newBook          avgt    5  74,280 ± 5,384  ns/op
HashCode.newBookWithHash  avgt    5  14,401 ± 0,041  ns/op

The results show that getting an identity hashCode of an existing object is notably faster than computing hashCode over the object fields (2.9 vs. 5 ns). However, generating a new identity hashCode is a really slow operation, even comparing to an object allocation.

Tay answered 17/11, 2020 at 0:56 Comment(2)
So is it slow because it needs to be put into the object header i.e. putting something into the object header is a slow operation? Or is the generation slow?Dues
@Dues Because the code to do it is not inlined into the compiled method, but is always performed through a call to VM runtime function.Tay
R
2

The performance difference is due to the fact that you are creating a new object for each hashCode() invocation in the benchmark, and the default hashCode() implementation caches its value in the object header, while the custom one obliviously does not. Writing to the object header takes a lot of time, since it involves a native call.

Repeated invocations of the default hashCode() implementation perform a little better than the custom one.

If you set -XX:-UseBiasedLocking, you will see that the performance difference decreases. Since biased locking information is stored in object headers too, and disabling it affects object layout, this is an additional proof.

Radke answered 16/11, 2020 at 7:44 Comment(2)
@Dues "Writing to the object header takes a lot of time, since it involves a native call." I would expect a native call to be the fastest of all calls, no?Maltz
@Maltz No because it has to cross the JVM boundary.Radke

© 2022 - 2024 — McMap. All rights reserved.