I get an error when using shap.plots.waterfall after generating the shap values
Asked Answered
W

2

8

For the code given below, if I just use the command shap.plots.waterfall(shap_values[6]) I get the error

'numpy.ndarray' object has no attribute 'base_values'

I have to firstly run these two commands:

explainer2 = shap.Explainer(clf.best_estimator_.predict, X_train)
shap_values = explainer2(X_train)

and then run the waterfall command to get the correct plot. Below is an example of where the error occurs:

from sklearn.datasets import make_classification
import seaborn as sns
import numpy as np
import pandas as pd
from matplotlib import pyplot as plt
import pickle
import joblib
import warnings
import shap
from sklearn.ensemble import RandomForestClassifier
from sklearn.model_selection import RandomizedSearchCV, GridSearchCV

f, (ax1,ax2) = plt.subplots(nrows=1, ncols=2,figsize=(20,8))
# Generate noisy Data
X_train,y_train = make_classification(n_samples=1000, 
                          n_features=50, 
                          n_informative=9, 
                          n_redundant=0, 
                          n_repeated=0, 
                          n_classes=10, 
                          n_clusters_per_class=1,
                          class_sep=9,
                          flip_y=0.2,
                          #weights=[0.5,0.5], 
                          random_state=17)

X_test,y_test = make_classification(n_samples=500, 
                          n_features=50, 
                          n_informative=9, 
                          n_redundant=0, 
                          n_repeated=0, 
                          n_classes=10, 
                          n_clusters_per_class=1,
                          class_sep=9,
                          flip_y=0.2,
                          #weights=[0.5,0.5], 
                          random_state=17)

model = RandomForestClassifier()

parameter_space = {
    'n_estimators': [10,50,100],
    'criterion': ['gini', 'entropy'],
    'max_depth': np.linspace(10,50,11),
}

clf = GridSearchCV(model, parameter_space, cv = 5, scoring = "accuracy", verbose = True) # model
my_model = clf.fit(X_train,y_train)
print(f'Best Parameters: {clf.best_params_}')

# save the model to disk
filename = f'Testt-RF.sav'
pickle.dump(clf, open(filename, 'wb'))

explainer = Explainer(clf.best_estimator_)
shap_values_tr1 = explainer.shap_values(X_train)

shap.plots.waterfall(shap_values[6])

Can you tell me the correct procedure to generate the shap.plots.waterfall for the train data?

Thanks!

Winterfeed answered 15/8, 2022 at 4:28 Comment(1)
You can't train a model on one dataset and predict on a different. The whole point of ML is that both should be drawn from a similar (same?) distributions.Witt
W
7

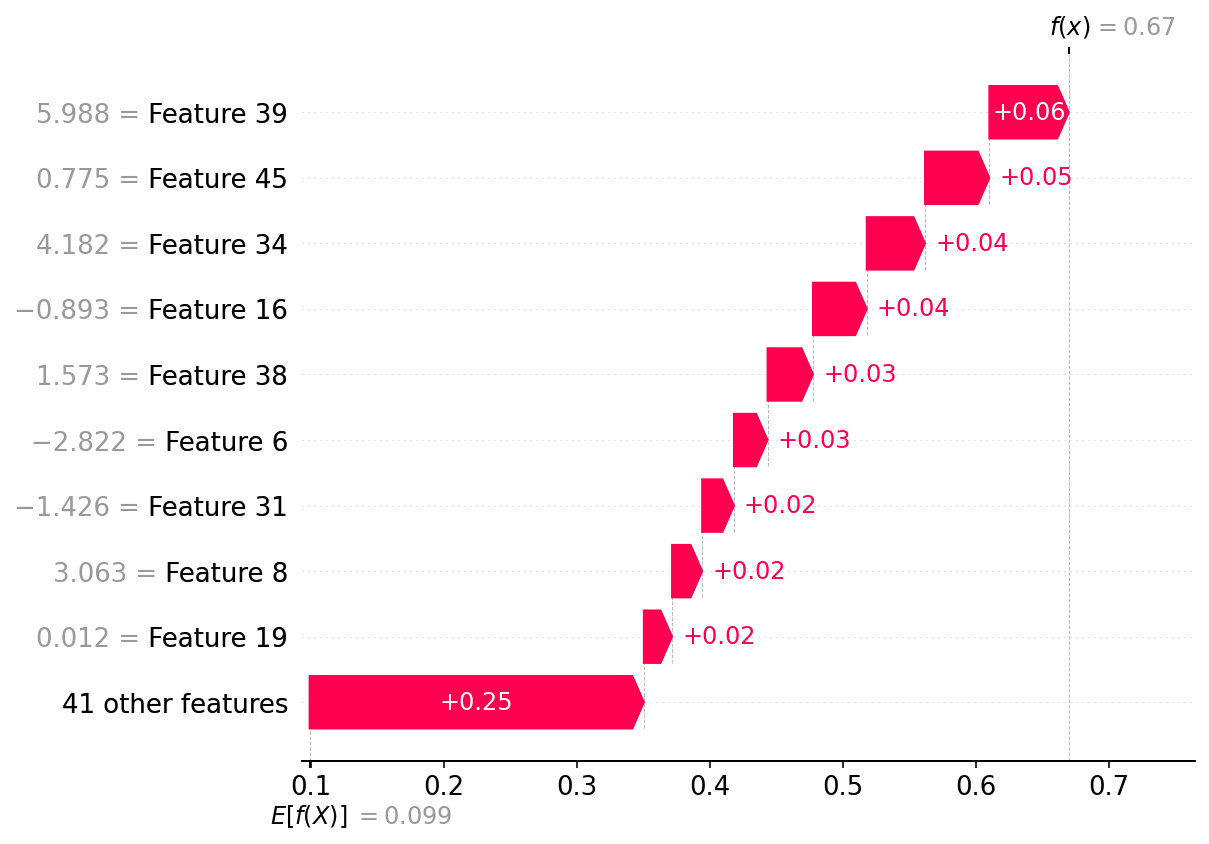
The following works for me:

from sklearn.datasets import make_classification
from shap import Explainer, Explanation
from sklearn.ensemble import RandomForestClassifier
from sklearn.model_selection import train_test_split
from shap import waterfall_plot

X, y = make_classification(1000, 50, n_informative=9, n_classes=10)
X_train, X_test, y_train, y_test = train_test_split(X, y, train_size=.75, random_state=42)
model = RandomForestClassifier()
model.fit(X_train, y_train)

explainer = Explainer(model)
sv = explainer(X_train)

exp = Explanation(sv[:,:,6], sv.base_values[:,6], X_train, feature_names=None)
idx = 7 # datapoint to explain
waterfall_plot(exp[idx])

enter image description here

Witt answered 16/8, 2022 at 3:52 Comment(5)
Yes to both, but you can actually check that visually by comparing shap predictions to model predictions, that must be equal when fed the same dataWitt
Thanks sincerely for your solution. I just wanted to get some clarification regarding your solution. In your example, X_train has a shape of (750 x 50). 750 samples with 50 features. For the line of code exp = Explanation(sv[:,:,6], sv.base_values[:,6], X_train, feature_names=None), that specifies that we are looking at class 7? And the `idx' is the sample row 8?Winterfeed
Thanks again! I can easily check the model prediction for idx 7 as predictions = model.predict(X_train); y_pred = predictions; y_pred[7]. How do I check the shap prediction to see if I also get the same answer?Winterfeed
0.67 that you see in top right corner of the plot is the proba for class 1, I believeWitt
I got an error for sv: too many indices for array: array. I cannot access like sv[:,:,6]. My sv contains only .values, .base_values and .data. Some tip about it?Raddle
F
1

This works for me:

shap.plots._waterfall.waterfall_legacy(explainer.expected_value[0], shap_values[0].values, df.values[0], feature, max_display=20)

enter image description here

Froe answered 11/4, 2023 at 9:48 Comment(0)

© 2022 - 2024 — McMap. All rights reserved.