R shiny - pop up window with options
Asked Answered
T

2

8

Im creating a shiny app that queries an SQL database. I want to warn the user if the queried data has entries on two dates. Moreover, I want the user to be able to select which set of data to query. Here is an example:

Server

# Create example data

set.seed(10)
MeasurementA <- rnorm(1000, 5, 2)
MeasurementB <- rnorm(1000, 5, 2)
Wafer <- rep(c(1:100), each=10)
ID <- rep(c(101:200), each=10)
Batch <- rep(LETTERS[seq(from=1, to =10)], each=100)
Date <- rep(seq(as.Date("2001-01-01"), length.out = 100, by="1 day"), each=10)

# Add data for Wafer 1 with a new date

W2 <- rep(1, each=10)
ID2 <- rep(101, each=10)
Batch2 <- rep("A", each=10)
Date2 <- rep(as.Date("2001-04-11"), each=10)
MA2 <- rnorm(10, 5, 2)
MB2 <- rnorm(10, 5, 2)

df <- data.frame(Batch, Wafer, ID, MeasurementA, MeasurementB, Date)
ee <- data.frame(Batch2, W2, ID2, MA2, MB2, Date2)
colnames(ee) <- c("Batch", "Wafer", "ID", "MeasurementA", "MeasurementB", "Date")

# Data frame now how two sets of date for Wafer 1 on different dates
dd <- rbind(df, ee)
dd$Date <- factor(dd$Date)


# Create local connection (in reality this will be a connection to a host site)

con <- dbConnect(RSQLite::SQLite(), ":memory:")
dbWriteTable(con, "dd", dd)
query <-  function(...) dbGetQuery(con, ...)

# Create empty data frames to populate

wq = data.frame()
sq = data.frame()

shinyServer(function(input, output){

  # create data frame to store reactive data set from query
  values <- reactiveValues()
  values$df <- data.frame()

  # Action button for first query
  d <- eventReactive(input$do, { input$wafer })

  # First stage of reactive query
  a <- reactive({ paste("Select ID from dd where Wafer=",d(), sep="") })

  wq <- reactive({  query( a() ) })

  # Output to confirm query is correct
  output$que <- renderPrint({ a() }) 
  output$pos <- renderPrint( wq()[1,1] )  

  # Action button to add results from query to a data frame
  e <- eventReactive(input$do2, { wq()[1,1] })

  b <- reactive({ paste("select cast(Wafer as varchar) as Wafer, cast(Batch as varchar) as Batch, MeasurementA, MeasurementB, Date from dd where ID=",e()," Order by  ID asc ;", sep="") })

  # observe e() so that data is not added until user presses action button  
  observe({
    if (!is.null(e())) {
      sq <- reactive({  query( b() ) })

      # add query to reactive data frame
      values$df <- rbind(isolate(values$df), sq())
    }
  })


  asub <- eventReactive(input$do3,{subset(values$df, MeasurementA > input$Von[1] & MeasurementA < input$Von[2] )})

  observeEvent(input$do4, {

    values$df <- NULL

  })

  output$boxV <- renderPlot({
    ggplot(asub(), aes_string('Wafer', input$char, fill='Batch')) + geom_boxplot() 
  })

  })

UI

shinyUI(fluidPage(
  titlePanel("Generic grapher"),
  sidebarLayout(
    sidebarPanel(

      numericInput("wafer", label = h3("Input wafer ID:"), value = NULL),

      actionButton("do", "Search wafer"),
      actionButton("do2", "Add to data frame"),
      actionButton("do3", "Show"),
      actionButton("do4", "Clear"),
      selectInput("char", label="Boxplot choice:",
                  choices = list("A"="MeasurementA", "B"="MeasurementB"),                            
                  selected="Von.fwd"),
      sliderInput("Von", label = "A range:",
                  min=0, max=10, value=c(0,10), step=0.1)

      ),

      mainPanel(
        verbatimTextOutput("que"), 
        verbatimTextOutput("pos"),
        plotOutput("boxV")
        #dataTableOutput(outputId="posi")
      )
    )
  )
)

In the above, if you search for wafer "1" it plots all the data even though there are two dates for wafer 1 (this is expected). So I was thinking that if when I click "Search wafer" I could get a popup if two dates existed for that wafer. So far I have read this:

Add a popup with error, warning to shiny

and this:

Create a pop-up menu with right click about an object

Which shows I can produce a warning message (although I havent tried doing this yet). But I wonder if there is some way to make the popup interactive so as to select the desired date. Perhaps I should contact the creator of shinyBS, that looks like my best option?

Teresiateresina answered 26/8, 2015 at 12:12 Comment(0)
G
3

Maybe you could use a conditionalPanel for that: http://shiny.rstudio.com/reference/shiny/latest/conditionalPanel.html

Gardol answered 26/8, 2015 at 14:20 Comment(4)
Thanks for your answer. Im not sure I can use conditionalPanel. I always want the plot to be displayed but select only one of the dates from the query. Unless im missing something?Teresiateresina
I was thinking you could use the conditionalPanel only on a selectInput with the dates of the selected wafer. The conditionalPanel would hide this input if there was less than two dates for the wafer.Gardol
ahhh I see. So just to be clear, I would query a wafer. If there was only one date there would be no input panel. However, if there were two dates then the input panel would appear and then let me choose a date for building the data frame? I like this idea.Teresiateresina
Exactly. You might want to read about session$clientData too. You can use it to verify if the said panel is hidden or not and subset your data accordingly.Gardol
P
6

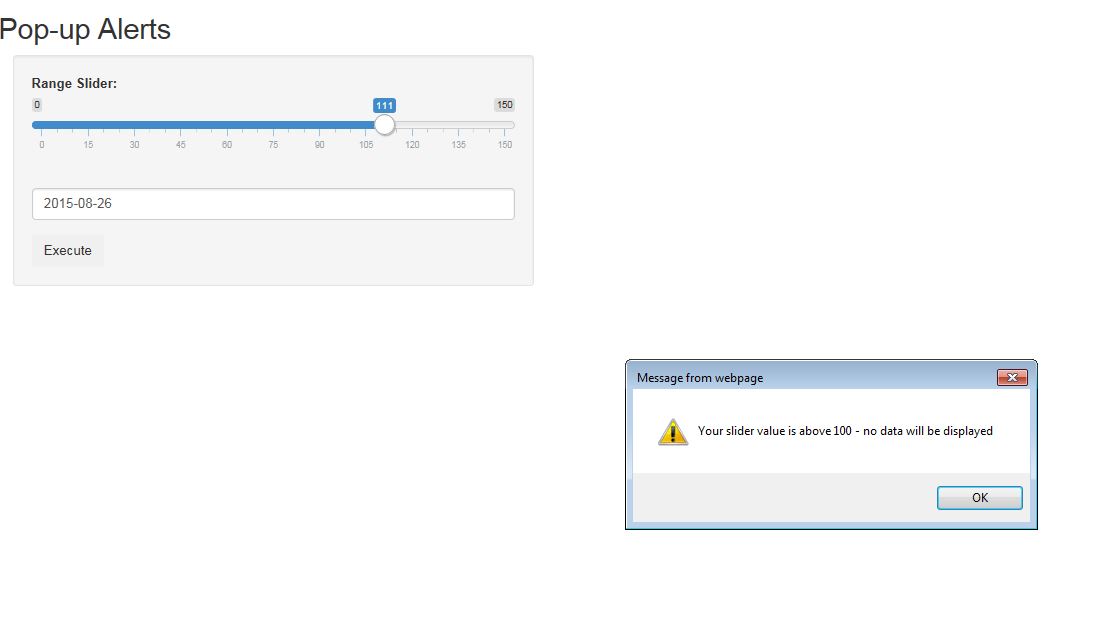
I created a sample App which should give you a good introduction on how you can use Alerts. I'm not using the alerts from shinyBS package as you can see, but instead I used session$sendCustomMessage to send a message with JS alert functionality. I've added some comments in the code so have a look. Note that I make use of the sub function to create the desired text by substituting my expression into the SOMETHING part of the string.

rm(list = ls())
library(shiny)
library(DT)

ui <- fluidPage(

  # Inlcude the line below in ui.R so you can send messages
  tags$head(tags$script(HTML('Shiny.addCustomMessageHandler("jsCode",function(message) {eval(message.value);});'))),
  titlePanel("Pop-up Alerts"),
  sidebarPanel(
    sliderInput("my_slider", "Range Slider:", min = 0, max = 150, value = 40, step=1),
    dateInput('my_daterange',label = '',value = Sys.Date()),
    actionButton("run","Execute")),
  mainPanel(DT::dataTableOutput('tbl'))
)

server <- function(input, output, session) {

  # Alert below will trigger if the slider is over 100
  observe({
    if(input$my_slider >= 100)
    {
      my_slider_check_test <- "Your slider value is above 100 - no data will be displayed"
      js_string <- 'alert("SOMETHING");'
      js_string <- sub("SOMETHING",my_slider_check_test,js_string)
      session$sendCustomMessage(type='jsCode', list(value = js_string))
    }
  })


  # Alert below about dates will notify you if you selected today
  observe({
    if (is.null(input$run) || input$run == 0){return()}
    isolate({
      input$run
      if(input$my_daterange == Sys.Date())
      {
        my_date_check_test <- "Today Selected"
        js_string <- 'alert("SOMETHING");'
        js_string <- sub("SOMETHING",my_date_check_test,js_string)
        session$sendCustomMessage(type='jsCode', list(value = js_string))
      }
      # Alert will also trigger and will notify about the dates
      if(input$my_daterange == Sys.Date())
      {
        my_date_check_test <- paste0("You selected: ",input$my_daterange)
        js_string <- 'alert("SOMETHING");'
        js_string <- sub("SOMETHING",my_date_check_test,js_string)
        session$sendCustomMessage(type='jsCode', list(value = js_string))
      }

    })
  })

  my_data <- reactive({

    if(input$run==0){return()}
    isolate({
      input$run
      if(input$my_slider >= 100)
      {
        # Alert below will trigger if you adjusted the date but slider is still 100
        my_slider_check_test <- "Slider is still over 100"
        js_string <- 'alert("SOMETHING");'
        js_string <- sub("SOMETHING",my_slider_check_test,js_string)
        session$sendCustomMessage(type='jsCode', list(value = js_string))
      }
      if(input$my_slider < 100)
      {
        iris[1:input$my_slider,]
      }
    })  
})
output$tbl = DT::renderDataTable(my_data(), options = list(lengthChange = FALSE))
}

shinyApp(ui = ui, server = server)

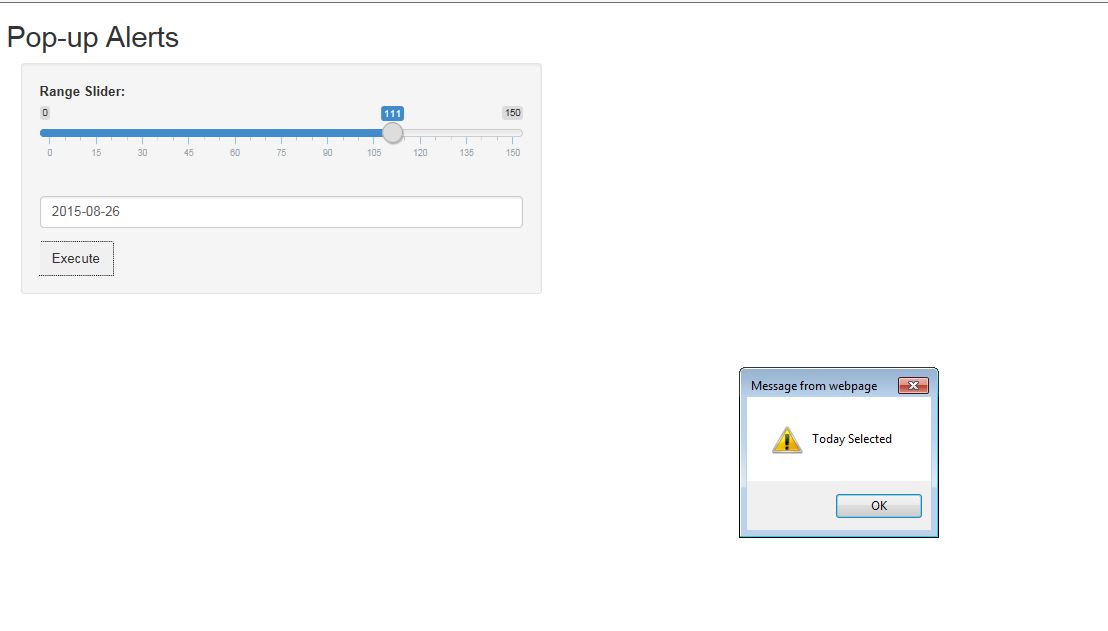
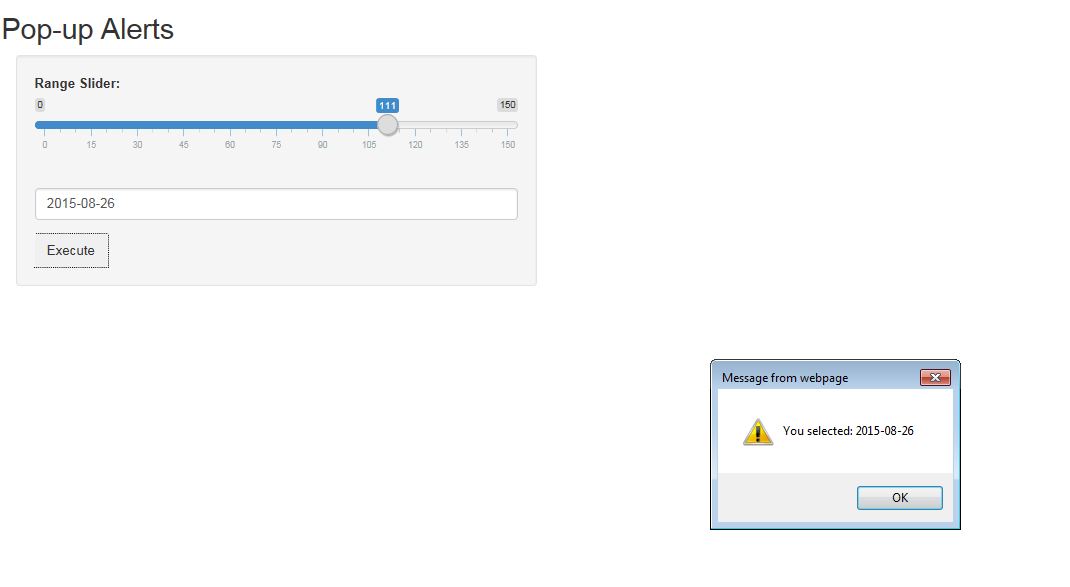
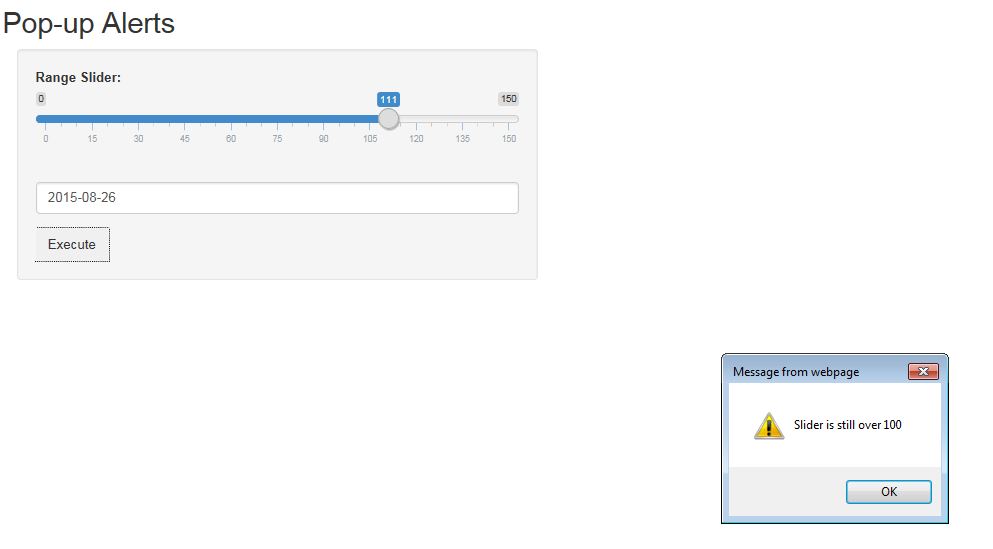
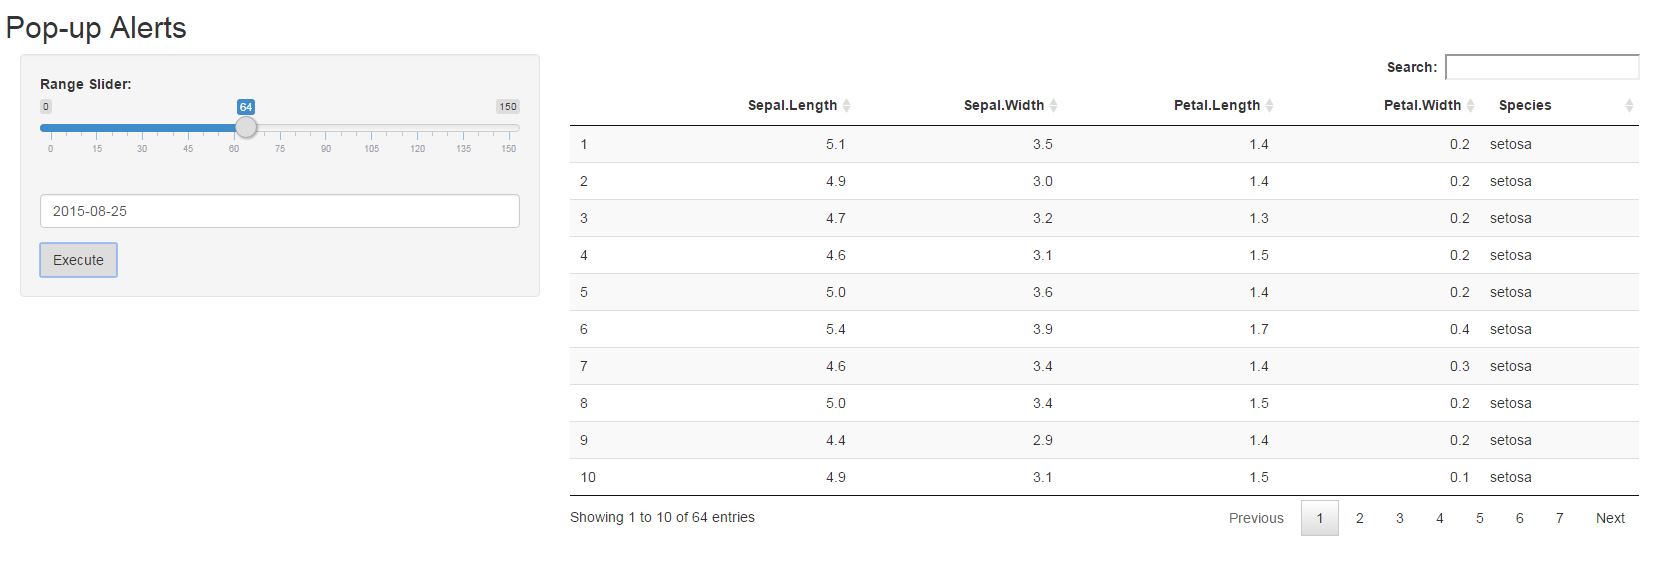
The output below of some pop-ups is in IE, Google Chrome will be different:

#1 Slider over 100 alert One

#2 Dates: Today Selected enter image description here

#3 Dates: Simply alerting by printing the date enter image description here

#4 Alert to show that the slider is still over 100 enter image description here

#5 If the slider is under 100, you get tableoutput

enter image description here

Pelecypod answered 26/8, 2015 at 13:58 Comment(5)
Wow, thank you for your answer. I think I have some work to do in terms of understanding how to implement this in my case but it is a great help.Teresiateresina
Just a comment that instead of using session$sendCustomMessage(type='jsCode', list(value = js_string)), you could use the shinyjs package to show the alert box with a simple shinyjs::info("Hello!")Cureton
Thanks for your advice daattali. I will read up on the packageTeresiateresina
Is there a way to create a pop-up window with an action button (or a return value to the server once "ok" is on the allert pop-up is clicked) on it?Journalize
@ChriiSchee, have a look at my answer here with modal implementation #31108145Pelecypod
G
3

Maybe you could use a conditionalPanel for that: http://shiny.rstudio.com/reference/shiny/latest/conditionalPanel.html

Gardol answered 26/8, 2015 at 14:20 Comment(4)
Thanks for your answer. Im not sure I can use conditionalPanel. I always want the plot to be displayed but select only one of the dates from the query. Unless im missing something?Teresiateresina
I was thinking you could use the conditionalPanel only on a selectInput with the dates of the selected wafer. The conditionalPanel would hide this input if there was less than two dates for the wafer.Gardol
ahhh I see. So just to be clear, I would query a wafer. If there was only one date there would be no input panel. However, if there were two dates then the input panel would appear and then let me choose a date for building the data frame? I like this idea.Teresiateresina
Exactly. You might want to read about session$clientData too. You can use it to verify if the said panel is hidden or not and subset your data accordingly.Gardol

© 2022 - 2024 — McMap. All rights reserved.