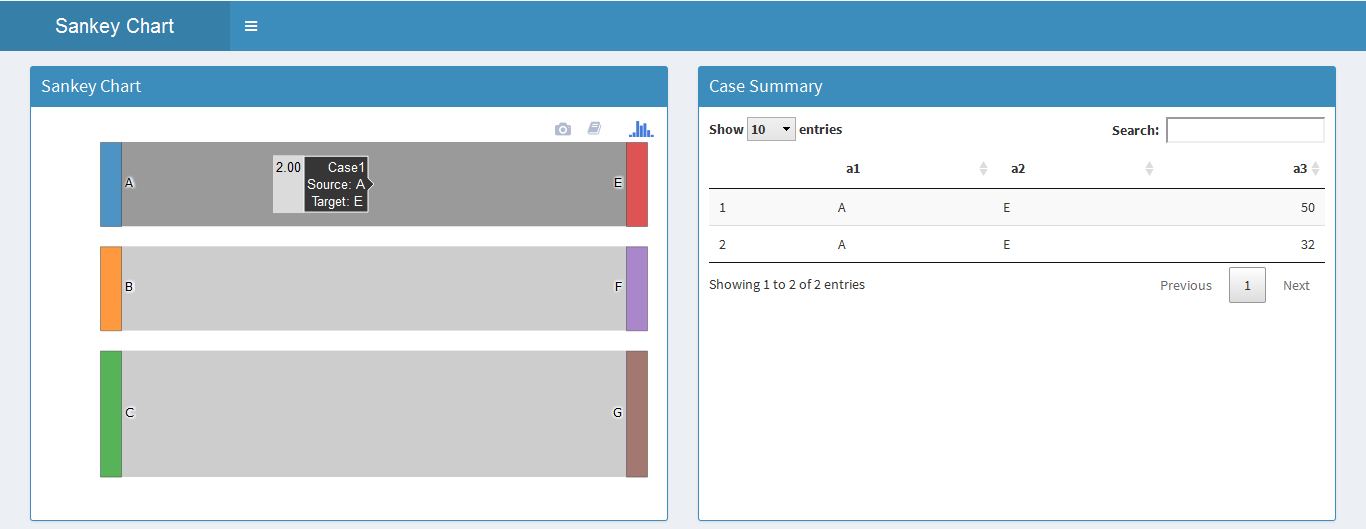
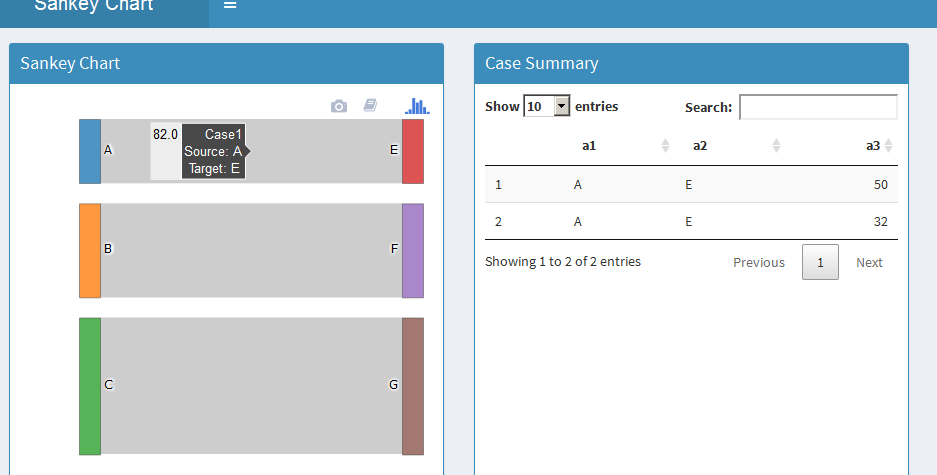
The following R shiny script creates a sankey chart as in the snapshot below. My requirement is that when I click on any link between the nodes on left and right i.e. "a1" and "a2", I want the total sum of corresponding "a3" to be present in the label. For Illustration, "A" in a1 and "E" in a2 together have value 50 and 32. So, I want to see 82 in the label when clicked on link, please help and thanks. Similary for all other a1,a2 pairs. Some tweak is needed in the list() function in server code below. Attaching the snapshot.
library(shiny)
library(shinydashboard)
library(plotly)
library(DT)
library(dplyr)
a1 = c("A","B","C","A","C","C","B")
a2 = c("E","F","G","E","G","G","F")
a3 = c(50,45,64,32,45,65,75)
a12 = data.frame(a1,a2,a3,stringsAsFactors = FALSE)
a12$a1 = as.character(a12$a1)
a12$a2 = as.character(a12$a2)
ui <- dashboardPage(
dashboardHeader(title = "Sankey Chart"),
dashboardSidebar(
width = 0
),
dashboardBody(
box(title = "Sankey Chart", status = "primary",height = "455" ,solidHeader =
T,plotlyOutput("sankey_plot")),
box( title = "Case Summary", status = "primary", height = "455",solidHeader
= T, dataTableOutput("sankey_table"))
))
server <- function(input, output)
{
sankeyData <- reactive({
sankeyData <- a12 %>%
  group_by(a1,a2) %>%
  count()
sankeyNodes <- list(label = c(sankeyData$a1,sankeyData$a2) %>% unique())
trace2 <- list(
  domain = list(
    x = c(0, 1),
    y = c(0, 1)
  ),
  link = list(
    label = paste0("Case",1:nrow(sankeyData)),
    source = sapply(sankeyData$a1,function(e) {which(e ==
                                                       sankeyNodes$label) },
   USE.NAMES = FALSE) - 1,
    target = sapply(sankeyData$a2,function(e) {which(e ==
                                                       sankeyNodes$label) },
    USE.NAMES = FALSE) - 1,
    value = sankeyData$n
  ),
  node = list(label = sankeyNodes$label),
  type = "sankey"
  )
  trace2
  })
  output$sankey_plot <- renderPlotly({
  trace2 <- sankeyData()
  p <- plot_ly()
  p <- add_trace(p, domain=trace2$domain, link=trace2$link,
               node=trace2$node, type=trace2$type)
  p
  })
  output$sankey_table <- renderDataTable({
  d <- event_data("plotly_click")
  req(d)
  trace2 <- sankeyData()
  sIdx <-  trace2$link$source[d$pointNumber+1]
  Source <- trace2$node$label[sIdx + 1 ]
  tIdx <- trace2$link$target[d$pointNumber+1]
  Target <- trace2$node$label[tIdx+1]
  a12 %>% filter(a1 == Source & a2 == Target)
  })
  }
  shinyApp(ui, server)


