Mean squared displacement [closed]
Asked Answered
L

2

0

I am investigating the motion of a single micrometer sized particle in a low density plasma. With a so called long distance microscope I have recorded the motion of a particle (2726 images, fps=60 Hz).

The x,y data in mm are available here: http://pastebin.com/qdMsaUHD

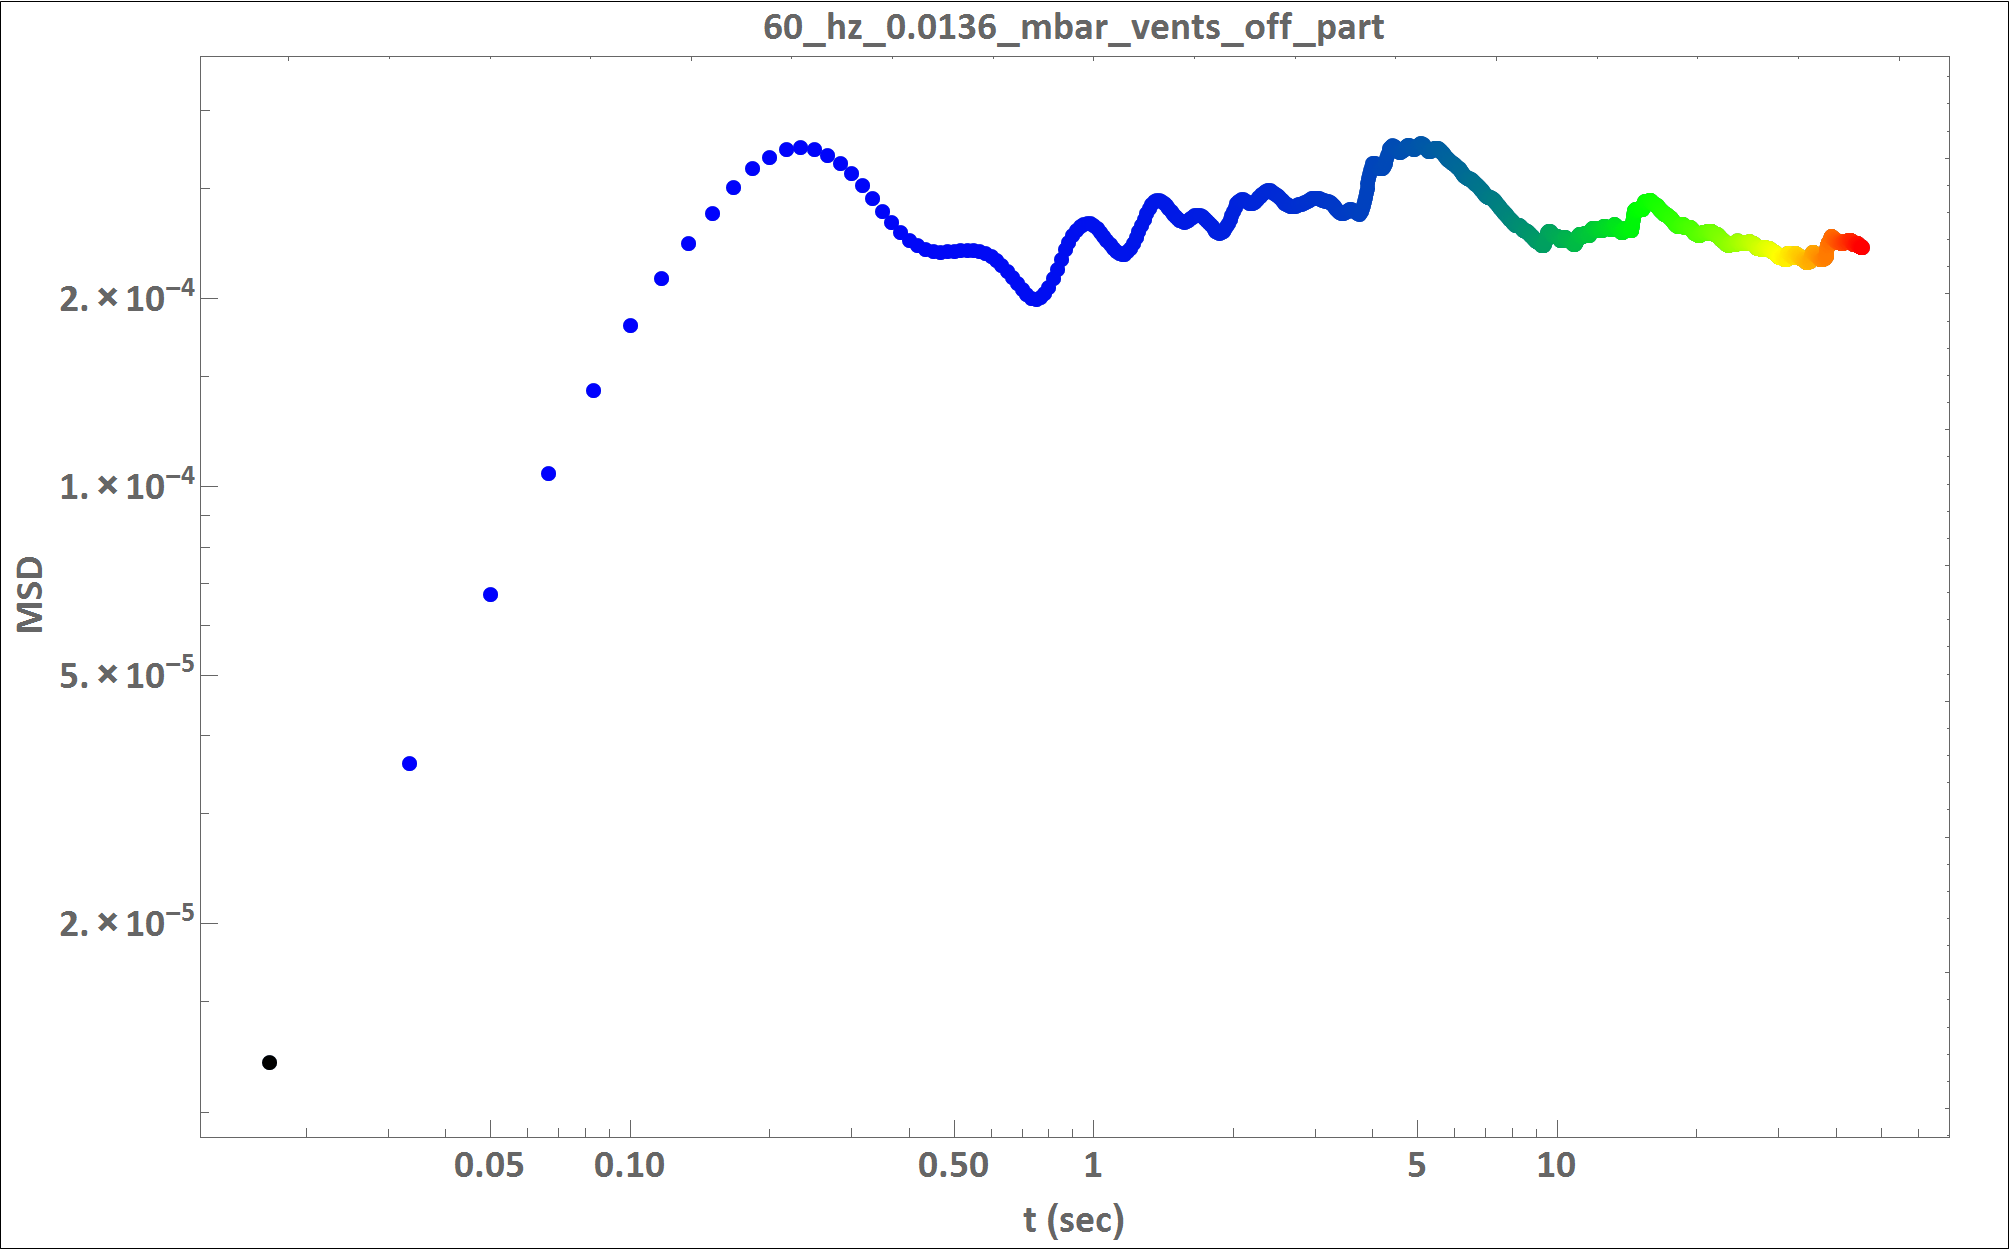
With mathematica I got the following log-log plot for the mean squared displacement (MSD):

enter image description here

I am new to Python and have searched for examples on how to read in the 2D coordinates from a file, calculate and display the MSD (mean and standard deviation).

I have seen that there are some answers which show how to calculate the MSD but I am not able to adapt them to my data.

I would appreciate very much if somebody could show me the full Python source code (with all imports) which is necessary to solve my problem.

That will be for me a great opportunity and a very concrete problem to start also programming with Python. Thank you very much in advance for your help.

I tried the following from one of the answers (Computing the mean square displacement of a 2d random walk in Python), but the code produced errors.

import numpy as np
import matplotlib.pyplot as plt

data= [[49.136926889715, 48.4423791821561],
[48.8104534783146, 51.0491783022365],
[48.5231487166892, 53.3485202014],
[48.2320069851565, 55.2569539728078],
[47.8817794028032, 56.993296770262],
[47.381875792142, 58.179721166033],
...
[45.3409434914228, 49.0259838546922]]

def compute_MSD(path):
   totalsize=len(path)
   msd=[]
   for i in range(totalsize-1):
       j=i+1
       msd.append(np.sum((path[0:-j]-path[j::])**2)/float(totalsize-j))

   msd=np.array(msd)
   return msd

result=compute_MSD(data)

plt.plot(result)
plt.show()
Leacock answered 2/4, 2016 at 12:3 Comment(1)
Have you read the data into python list ?Micrococcus
C
2

My graphs look slightly different than yours which likely stems from a misunderstanding of exactly what it is you are calculating, however I believe this addresses the basic idea.

plasma = [[0.09296720430107527, 0.09280376344086022],
[0.09230113636363636, 0.09769886363636364],
[0.09130555555555556, 0.10198777777777777],
...

import pandas as pd
import numpy as np
import matplotlib.pyplot as plt

df = pd.DataFrame(plasma, columns=['x', 'y'])
df['time'] = np.arange(0,len(df)) / 60.0
df['dist'] = np.sqrt(df['x']**2 + df['y']**2)
df['MSD'] = pd.rolling_mean((np.abs(df['dist'])**2), len(df), min_periods=1)

The above is my interpretation of what you mean by MSD. I am using distance from the origin, i.e. sqrt(x^2 + y^2) and then applying the following definition

Then you can create a plot using matplotlib as follows

plt.loglog(df['time'], df['MSD'], 'o')
plt.xlabel('t (sec)')
plt.ylabel('MSD')
plt.show()

enter image description here

If you want to touch up / refine the graphs an excellent place to get a handle on matplotlib is the tutorial section, here.

Centipoise answered 2/4, 2016 at 13:13 Comment(2)
Thank you very much ... I have to check why your y values are different and also the curve variation looks different ... it can also be that I made a mistake ... but it helps meLeacock
I was also unclear what colour in your plot above representedCentipoise
M
0

Numpy has a standard function to calculate standard deviation. You can use numpy.std function. Give the list as input and it would output the result. You don't need to write those loops to do it.

To get same result as MATLAB set ddof = 1 in argument to numpy.std function.

Refer here for examples.

Micrococcus answered 2/4, 2016 at 12:44 Comment(1)
my question is mainly about the mean squared displacement ...Leacock

© 2022 - 2024 — McMap. All rights reserved.