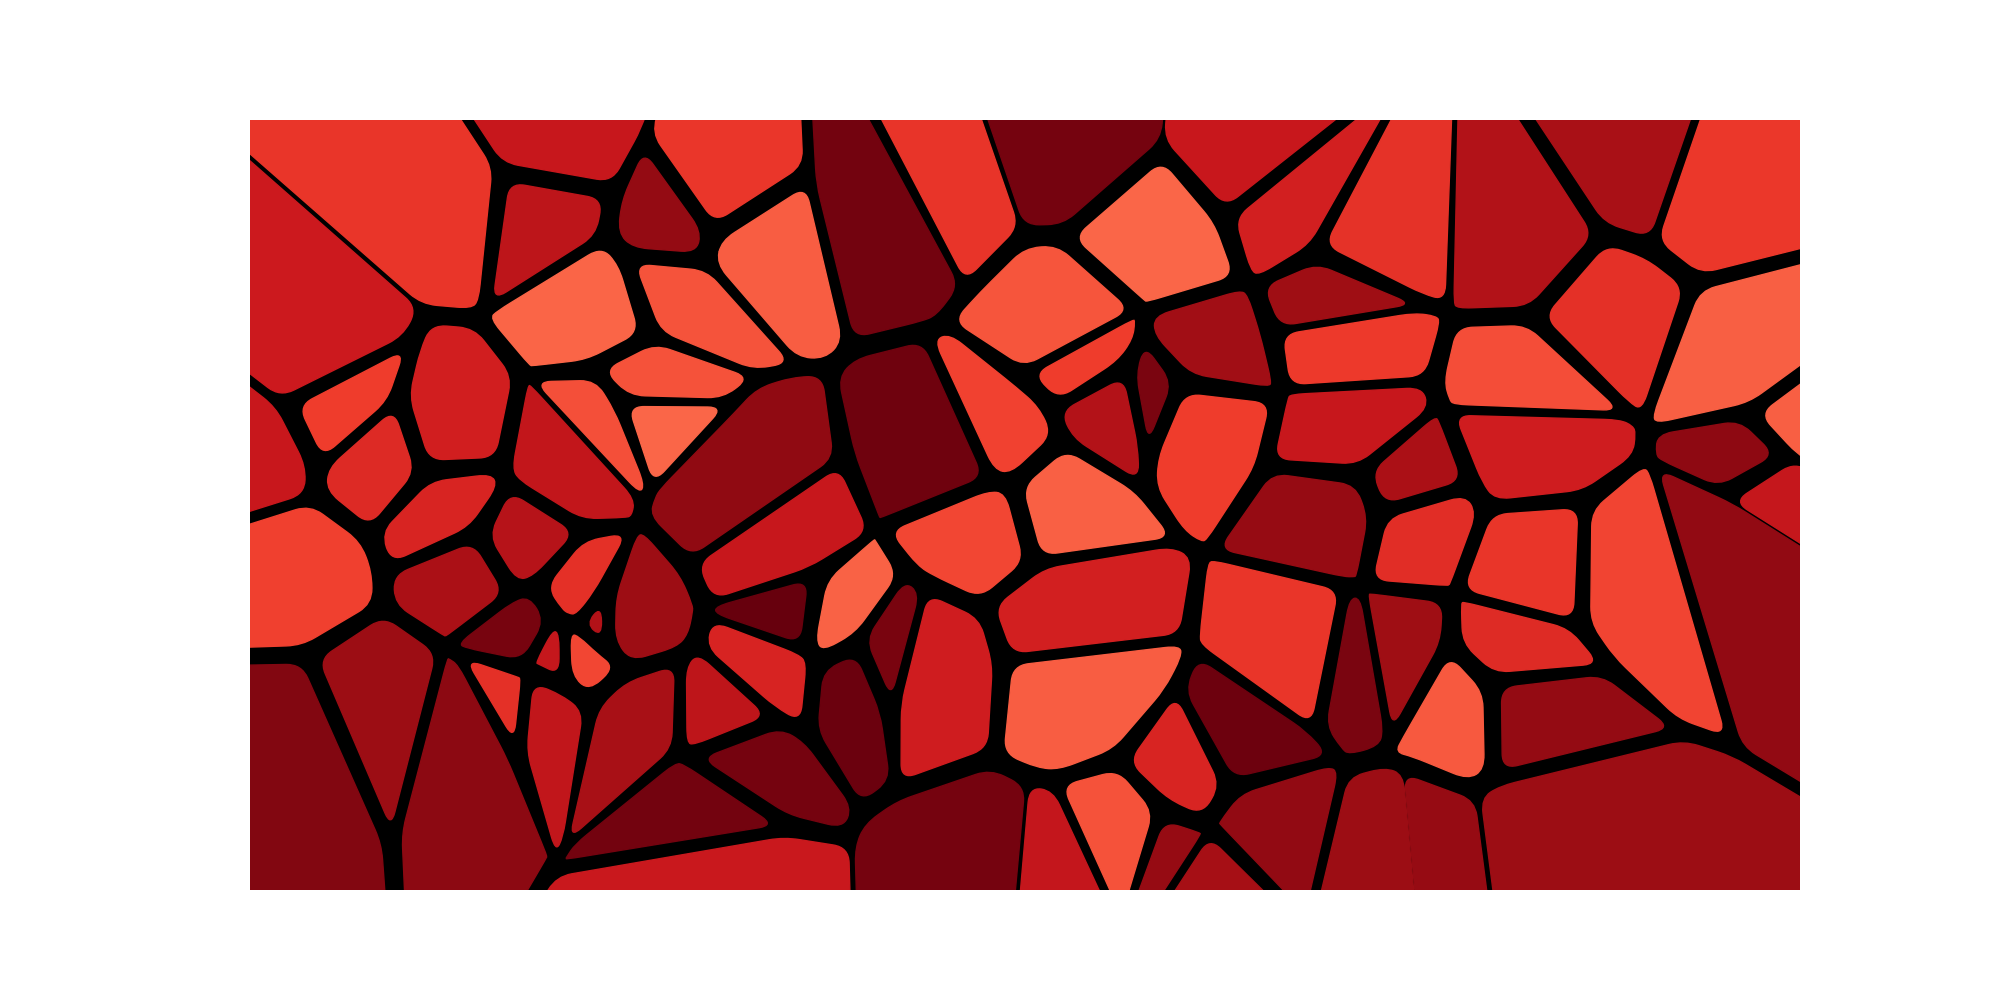
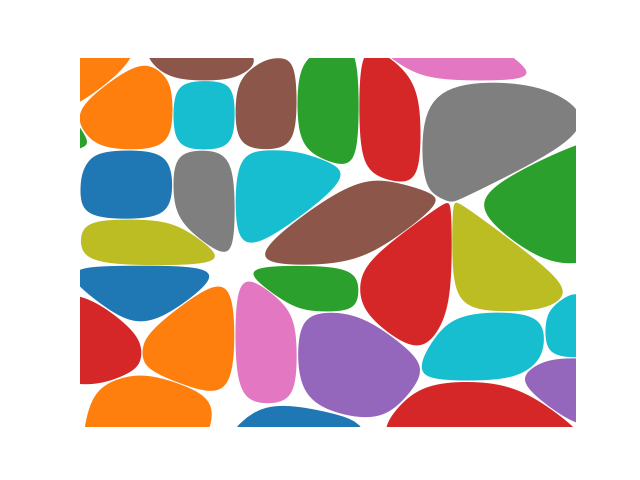
I'm trying to create some artistic "plots" like the ones below: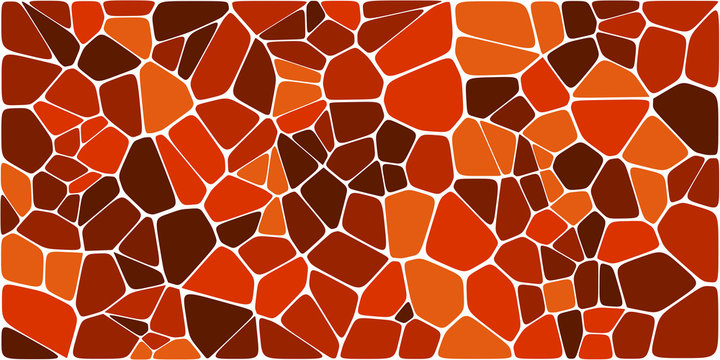
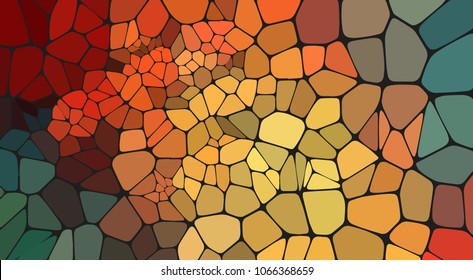
The color of the regions do not really matter, what I'm trying to achieve is the variable "thickness" of the edges along the Voronoi regions (espescially, how they look like a bigger rounded blob where they meet in corners, and thinner at their middle point).
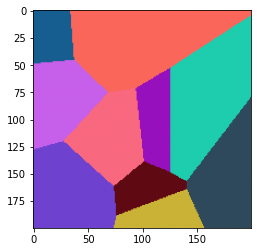
I've tried by "painting manually" each pixel based on the minimum distance to each centroid (each associated with a color):
n_centroids = 10
centroids = [(random.randint(0, h), random.randint(0, w)) for _ in range(n_centroids)]
colors = np.array([np.random.choice(range(256), size=3) for _ in range(n_centroids)]) / 255

for x, y in it.product(range(h), range(w)):
    distances = np.sqrt([(x - c[0])**2 + (y - c[1])**2 for c in centroids])
    centroid_i = np.argmin(distances)
    img[x, y] = colors[centroid_i]

plt.imshow(img, cmap='gray')
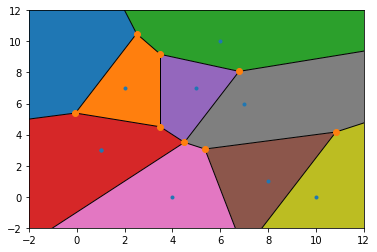
Or by scipy.spatial.Voronoi, that also gives me the vertices points, although I still can't see how I can draw a line through them with the desired variable thickness.
from scipy.spatial import Voronoi, voronoi_plot_2d

# make up data points
points = [(random.randint(0, 10), random.randint(0, 10)) for _ in range(10)]

# add 4 distant dummy points
points = np.append(points, [[999,999], [-999,999], [999,-999], [-999,-999]], axis = 0)

# compute Voronoi tesselation
vor = Voronoi(points)

# plot
voronoi_plot_2d(vor)

# colorize
for region in vor.regions:
    if not -1 in region:
        polygon = [vor.vertices[i] for i in region]
        plt.fill(*zip(*polygon))

# fix the range of axes
plt.xlim([-2,12]), plt.ylim([-2,12])
plt.show()
Edit:
I've managed to get a somewhat satisfying result via erosion + corner smoothing (via median filter as suggested in the comments) on each individual region, then drawing it into a black background.
res = np.zeros((h,w,3))
for color in colors:
    region = (img == color)[:,:,0]
    region = region.astype(np.uint8) * 255
    region = sg.medfilt2d(region, 15) # smooth corners
    # make edges from eroding regions
    region = cv2.erode(region, np.ones((3, 3), np.uint8))
    region = region.astype(bool)
    res[region] = color

plt.imshow(res)
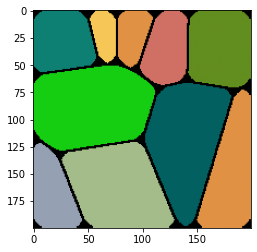 But as you can see the "stretched" line along the boundaries/edges of the regions is not quite there. Any other suggestions?

