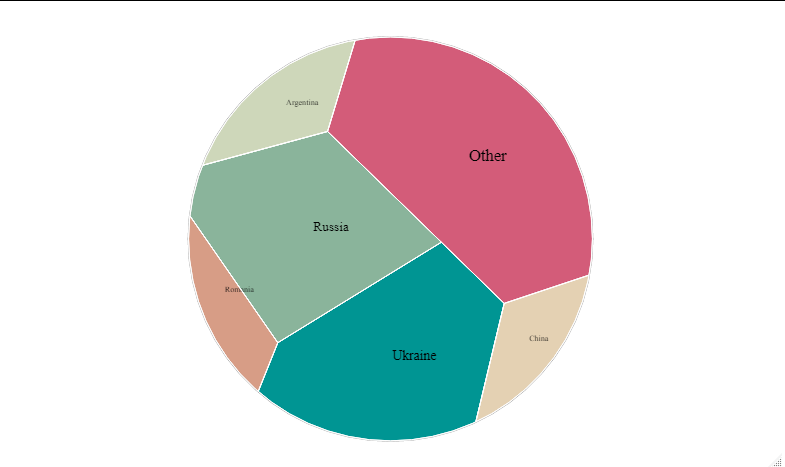
I have a data frame that looks like this and I want to create a circular voronoi diagram with it
df <- data.frame(country = c("Ukraine", "Russia", "Argentina", "China", "Romania", "Other"),
                 prod = c(11.0, 10.6, 3.1, 2.4, 2.1, 15.3))

df
#>     country prod
#> 1   Ukraine 11.0
#> 2    Russia 10.6
#> 3 Argentina  3.1
#> 4     China  2.4
#> 5   Romania  2.1
#> 6     Other 15.3
Created on 2022-04-08 by the reprex package (v2.0.1)
library(ggplot2)
library(dplyr)
#>
#> Attaching package: 'dplyr'
#> The following objects are masked from 'package:stats':
#>
#>     filter, lag
#> The following objects are masked from 'package:base':
#>
#>     intersect, setdiff, setequal, union
library("ggvoronoi")

df <- data.frame(country = c("Ukraine", "Russia", "Argentina", "China", "Romania", "Other"),
                 prod = c(11.0, 10.6, 3.1, 2.4, 2.1, 15.3))

ggplot(df, aes(country, prod)) +
  geom_voronoi(aes(fill=prod)) +
  theme_minimal()

Created on 2022-04-08 by the reprex package (v2.0.1)
Does anyone have an idea of how I could make it circular? I have found this github link but its missing the data that I need to convert polygons to a circular voronoi https://github.com/nrennie/30DayChartChallenge/blob/main/2022/scripts/04_flora.R

