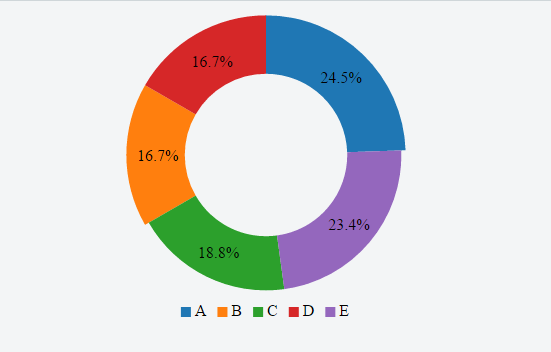
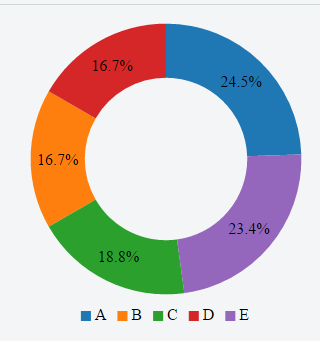
var currentSlice;
var chart = c3.generate({
data: {
x: 'x',
columns: [
['x', '2013-01-01', '2013-01-02', '2013-01-03', '2013-01-04', '2013-01-05', '2013-01-06'],
['A', 30, 200, 100, 400, 150, 250],
['B', 130, 100, 140, 200, 150, 50],
['C', 50, 100, 130, 240, 200, 150],
['D', 130, 100, 140, 200, 150, 50],
['E', 130, 150, 200, 300, 200, 100]
],
type: 'donut',
onclick: function (e) {
},
onmouseover: function (d, i) {
},
onmouseout: function (d, i) {
chart.internal.expandArc(['A', 'B', 'D'])
}
},
axis: {
x: {
type: 'timeseries',
tick: {
format: '%Y-%m-%d',
centered: true,
position: 'inner-right'
}
}
},
bindto: '#dash',
bar: {
width: {
ratio: 0.5 // this makes bar width 50% of length between ticks
}
},
pie: {
expand: true,
},
tooltip: {
grouped: false,
contents: function (data, defaultTitleFormat, defaultValueFormat, color) {
// console.log("Containt");
// console.log(data, defaultTitleFormat, defaultValueFormat, color);
return "<p style='border:1px solid red;'>" + data[0].value + "</p>";
}
}
});
setTimeout(function () {
    chart.internal.expandArc(['A', 'B', 'D'])
}, 0)
 p {
   line-height: 1;
   font-weight: bold;
   padding: 5px 12px;
   background: rgba(0, 0, 0, 0.8);
   color: #fff;
   border-radius: 4px;
   line-height: 15px;
   font-size: 12px;
   min-width: 91px;
 }
<script src="https://cdnjs.cloudflare.com/ajax/libs/d3/3.4.11/d3.min.js"></script>
<script src="https://cdnjs.cloudflare.com/ajax/libs/c3/0.4.10/c3.js"></script>
<div id="dash"></div>


